NALP Bulletin+
December 2025
Since the Class of 2020, NALP has collected parental education as part of the Employment Report and Salary Survey. This article examines five years of trend data to understand how employment outcomes vary by both level of parental education and race/ethnicity. For the Class of 2024, 61% of graduates provided parental education data, and 92% of law schools submitted parental education data for at least some of their graduates. This reflects broad institutional efforts to capture this important demographic information.
Parental Education Levels
Based on parental education data, NALP classifies graduates into three major groups:
- First-gen college students: Graduates who do not have at least one parent/guardian with a bachelor’s degree or a higher degree.
- Continuing-gen college students: Graduates who have at least one parent/guardian with a bachelor’s degree or higher degree, but whose parents/guardians all lack a JD degree (i.e., they do not have a lawyer parent).
- Continuing-gen JD students: Graduates who have at least one parent/guardian with a JD degree (i.e., they have a lawyer parent).
Who Are First-Gen College Students?
For the Class of 2024, 21% of law graduates identified as first-generation college students. Consistent with prior years, Latinx, Black, Native Hawaiian, and other Pacific Islander graduates were the most likely to identify as first-gen, while White graduates were the least likely to identify as first-gen. (See Chart 1.)
Employment Disparities
First-generation college students consistently find employment at lower rates compared to their continuing-generation college and JD peers. Chart 2 illustrates these disparities over time, where a negative value indicates both the presence and size of the employment gap. The differential is especially pronounced in positions for which bar admission is required, i.e., attorney positions, although these gaps have narrowed somewhat since 2020.
Sector Destinations
For employed graduates, there are also differences in sector destinations by parental education levels. Chart 3 displays sector information for the Class of 2024, however, these patterns have been consistent since 2020. First-gen college students are the most likely to work in business, government, and public interest, while continuing-gen JD students are most likely to be employed in private practice or judicial clerkships.
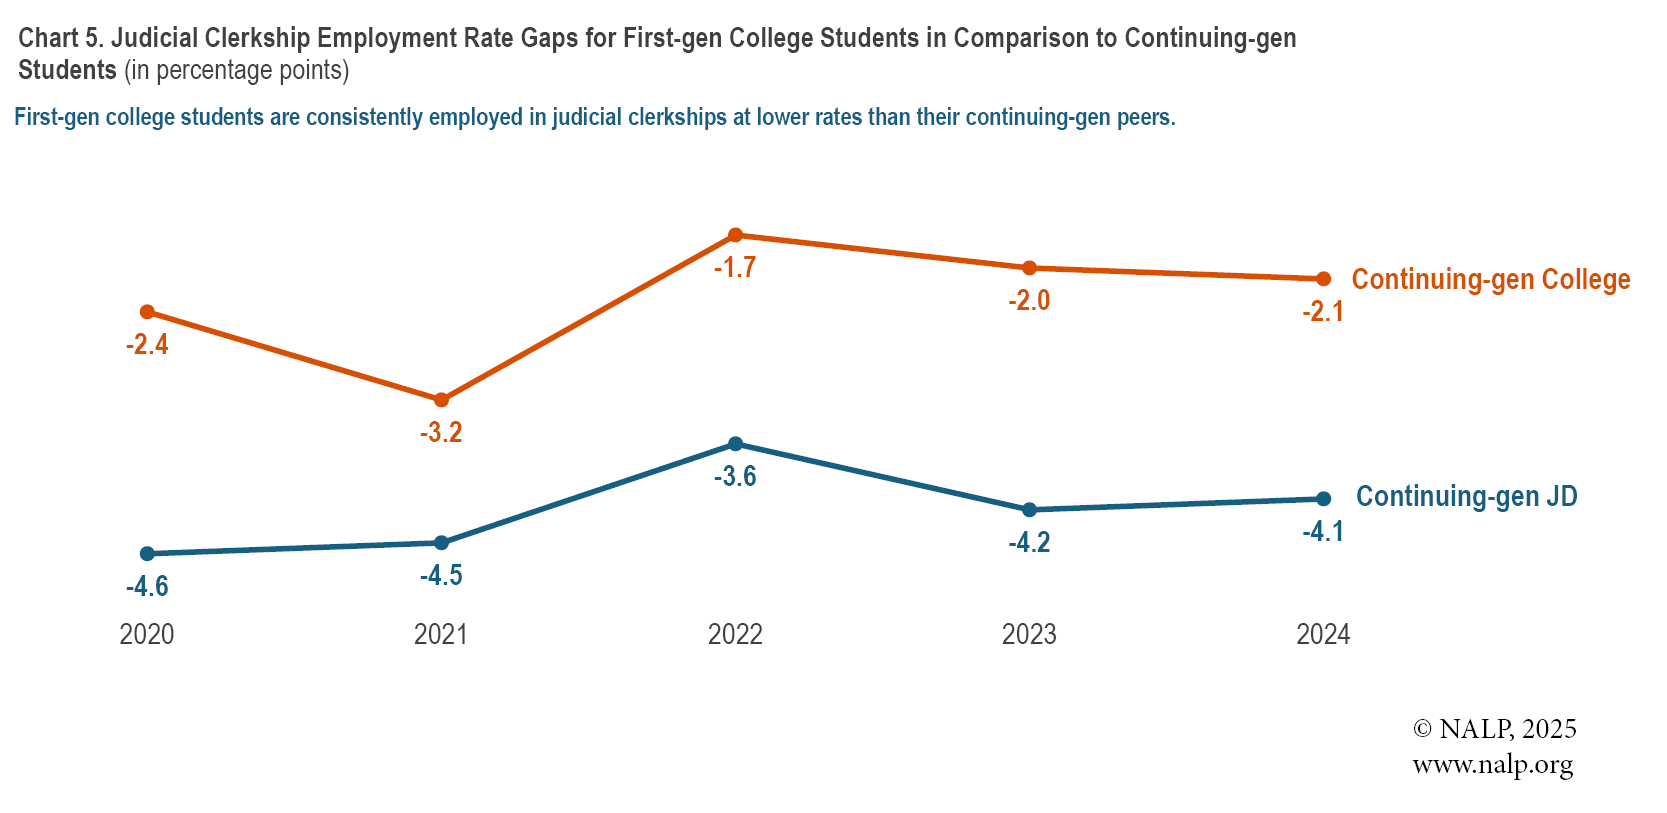
Chart 4 and Chart 5 illustrate those persistent disparities specifically in private practice and judicial clerkship employment over this five-year period. Among those entering private practice, first-gen college students are more likely to work in small law firms of 1-10 lawyers and are less likely to be employed at a large firm of more than 500 lawyers as compared to their continuing-generation peers. Similarly, first-gen college students who are judicial clerks are more likely to obtain state clerkships, while graduates with a lawyer parent are more likely to secure federal clerkships.
Largest Disparities Exist for First-Gen College Students of Color
When parental education is examined in conjunction with race/ethnicity, there are even starker differences. Charts 6-8 compare outcomes to White, continuing-generation JD graduates — the group with the highest overall employment rates.
Chart 6 shows consistent employment rate gaps for graduates of color with a lawyer parent, White first-gen students, and first-gen students of color, with the largest disparities apparent for first-gen students of color. Chart 7 illustrates that these disparities are even wider in jobs requiring bar admission, with employment rate gaps ranging from four percentage points for graduates of color with a lawyer parent to nearly 11 points for first-gen graduates of color. Although the differential is smallest for continuing-gen students of color, concerningly that gap grew this year to its largest level since the Class of 2021, while gaps for first-gen students were at their lowest point across this five-year period.
Chart 8 further disaggregates employment in these bar admission required positions by race/ethnicity. Black or African first-gen students have faced the largest and most persistent disparities, with a gap of more than 18 percentage points for the Class of 2024. While gaps have narrowed since 2020 for Asian, Black, and Latinx first-gen graduates, they remain significant — ranging from approximately eight points for Latinx graduates to 18 points for Black graduates. Troubling, the gap widened this year for both Asian and Black, even as it reached its lowest point for Latinx graduates.
Additional Resources
First-generation college students face distinct challenges in both law school and when entering the legal profession. Without the benefit of parents who can share firsthand experiences in higher education, these students must often chart their own course through college and law school. This lack of inherited social capital not only makes academic and career navigation more difficult, but it can also bring added pressure to new challenges, such as early recruiting timelines.
NALP members can access NALP’s Bulletin+ archives or the Tips and Best Practices for Initiating or Supplementing First-Generation Programming for Law Students for resources to help support their career journeys. Additional information on employment outcomes by level of parental education is included in Jobs & JDs: Employment and Salaries of New Law Graduates, Class of 2024— now available for purchase in the NALP Bookstore.
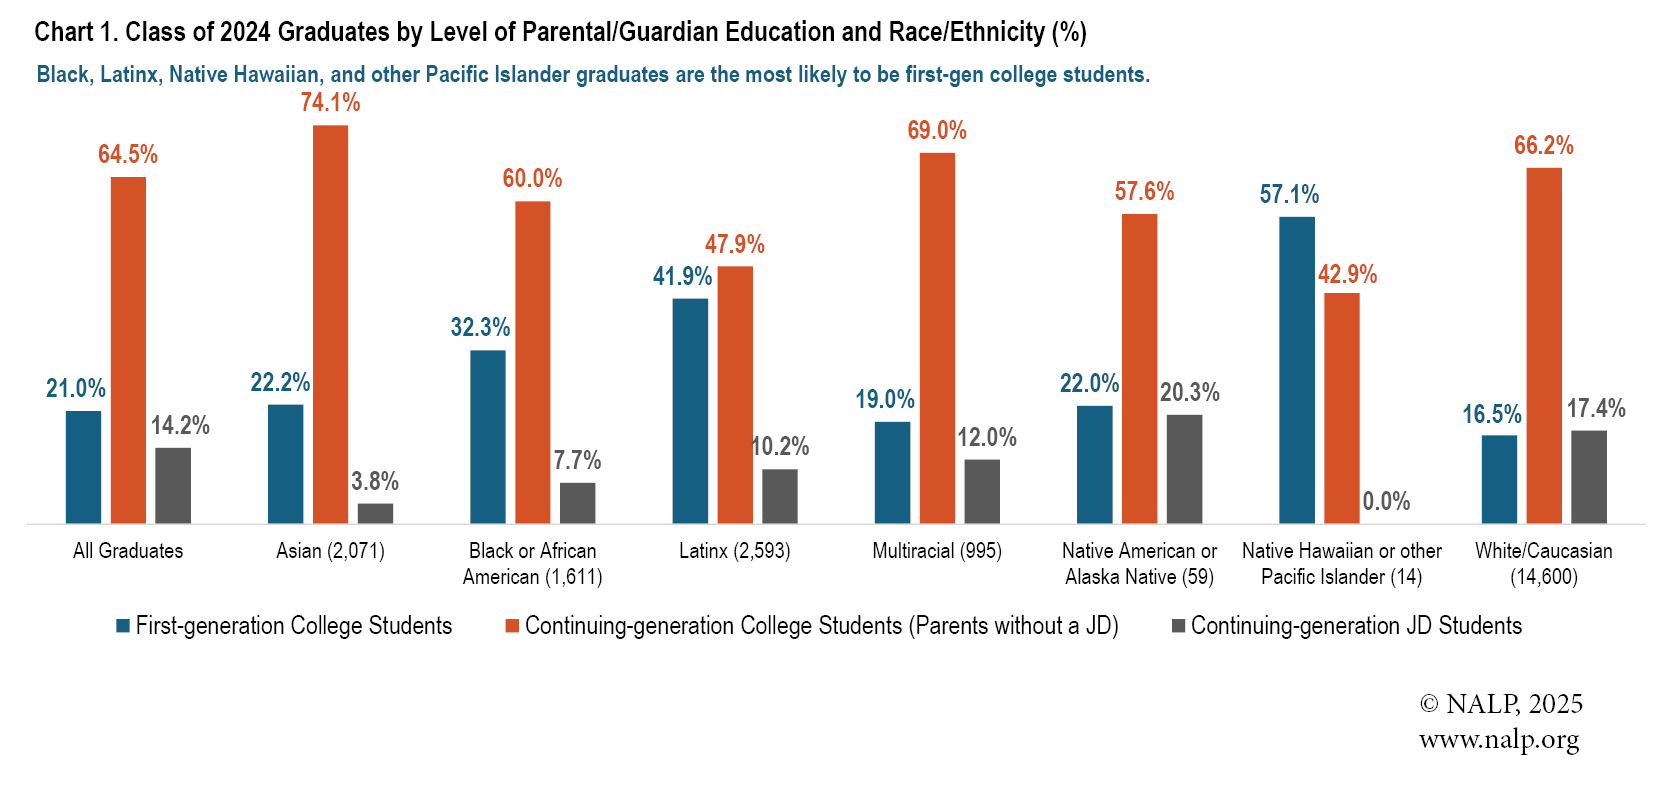
Note: Data are based on graduates for whom the appropriate demographic information was reported. Overall, approximately 58% of Class of 2024 graduates reported both parental/guardian education and race/ethnicity information. Percentages may not add up to 100% because a small number of graduates reported information for only one of the two parental/guardian education items.
Source: NALP's Class of 2024 Employment Report and Salary Survey
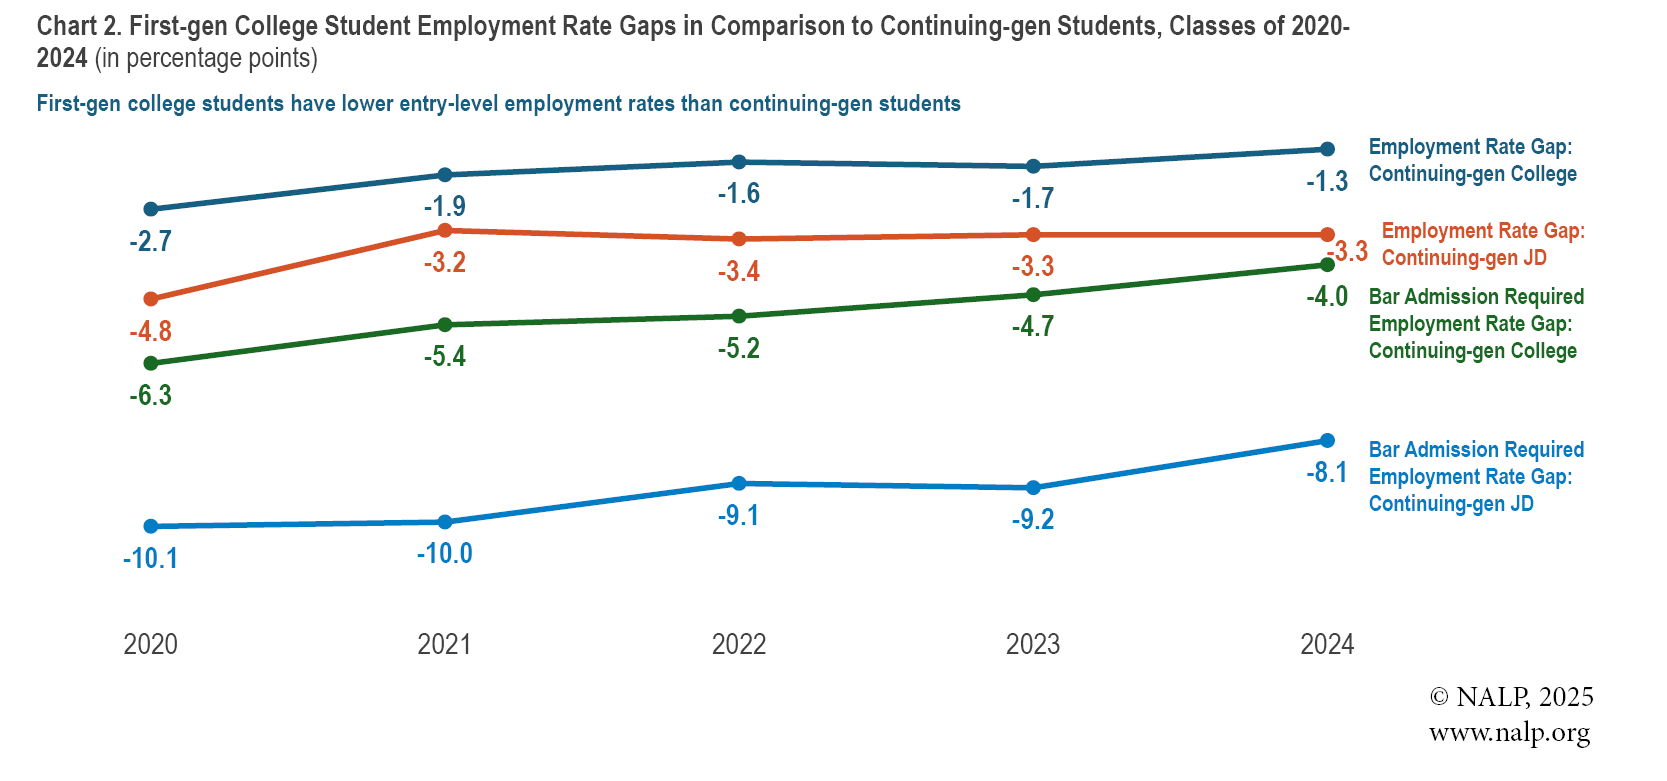
Note: A negative number indicates that first-gen college students had a lower employment rate compared to continuing-generation students and the size of that employment gap. Bar admission required jobs are attorney positions. Employment is measured in mid-March of the year following graduation (approximately 10 months post-graduation).
Source: NALP’s Employment Report and Salary Survey, Classes of 2020-2024
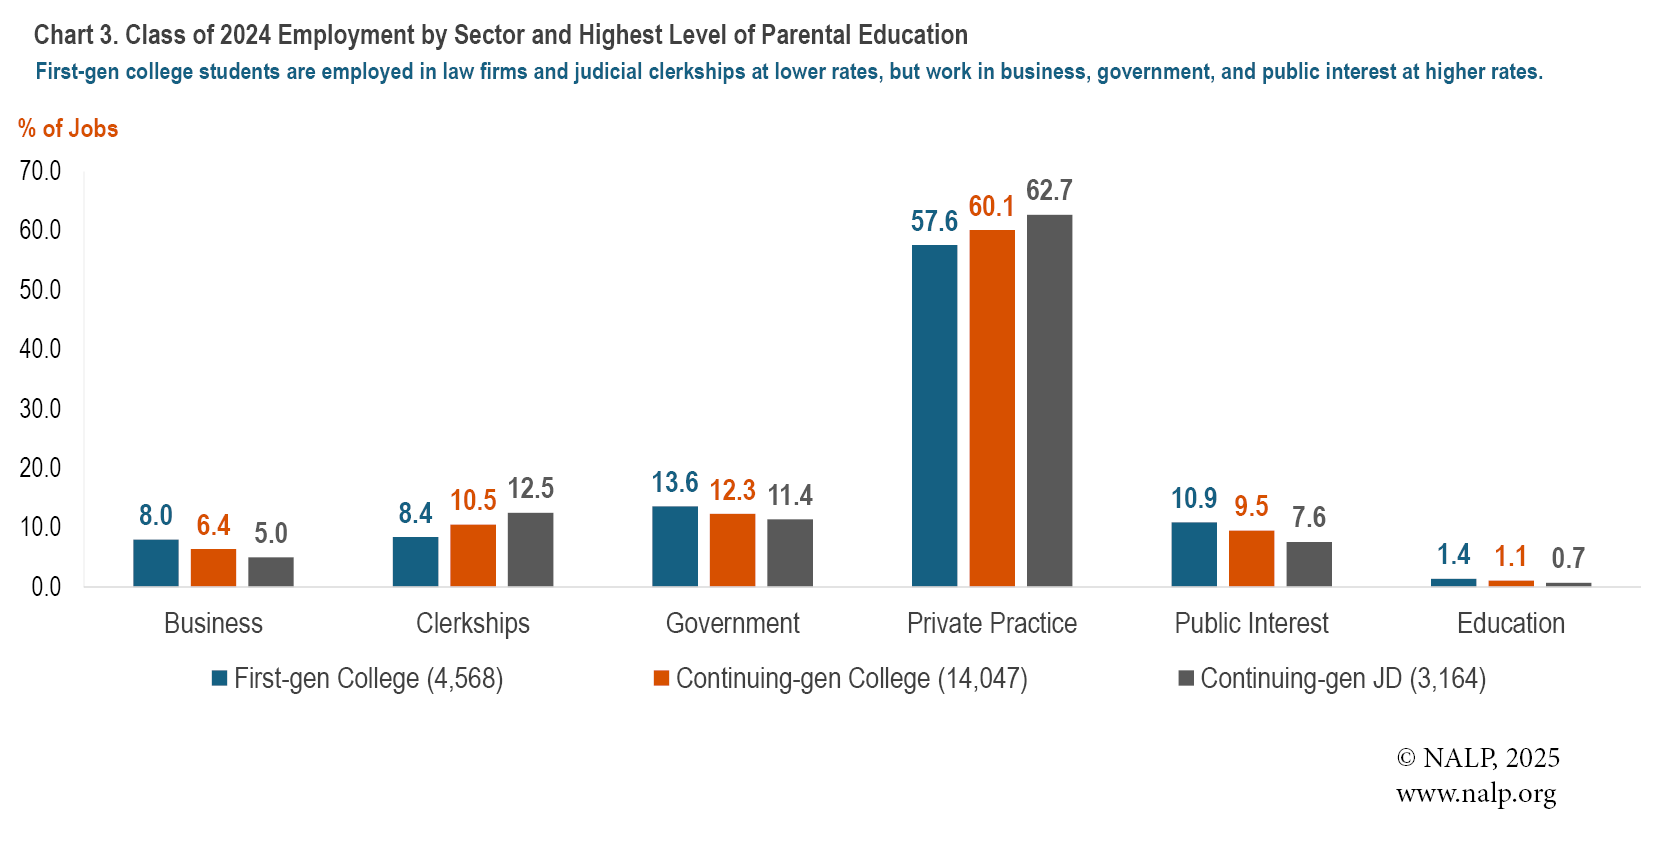
Note: Figures represent the percentage of employed graduates in each sector.
Source: NALP’s Class of 2024 Employment Report and Salary Survey
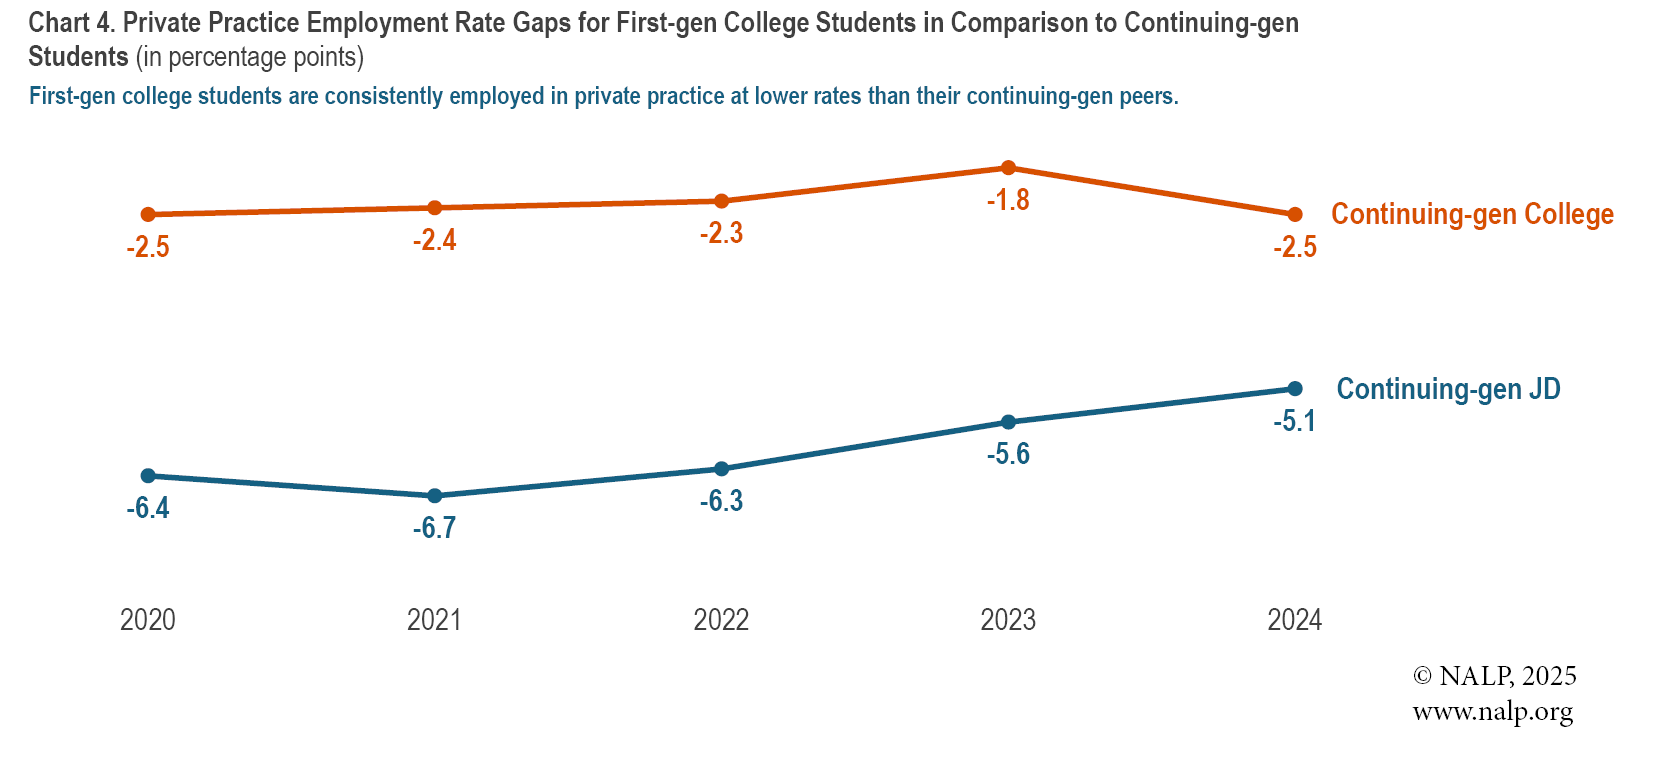
Note: A negative number indicates that first-gen college students had a lower employment rate compared to continuing-generation students and the size of that employment gap. Employment is measured in mid-March of the year following graduation (approximately 10 months post-graduation).
Source: NALP’s Employment Report and Salary Survey, Classes of 2020-2024
Note: A negative number indicates that first-gen college students had a lower employment rate compared to continuing-generation students and the size of that employment gap. Employment is measured in March of the year following graduation (approximately 10 months post-graduation).
Source: NALP’s Employment Report and Salary Survey, Classes of 2020-2024
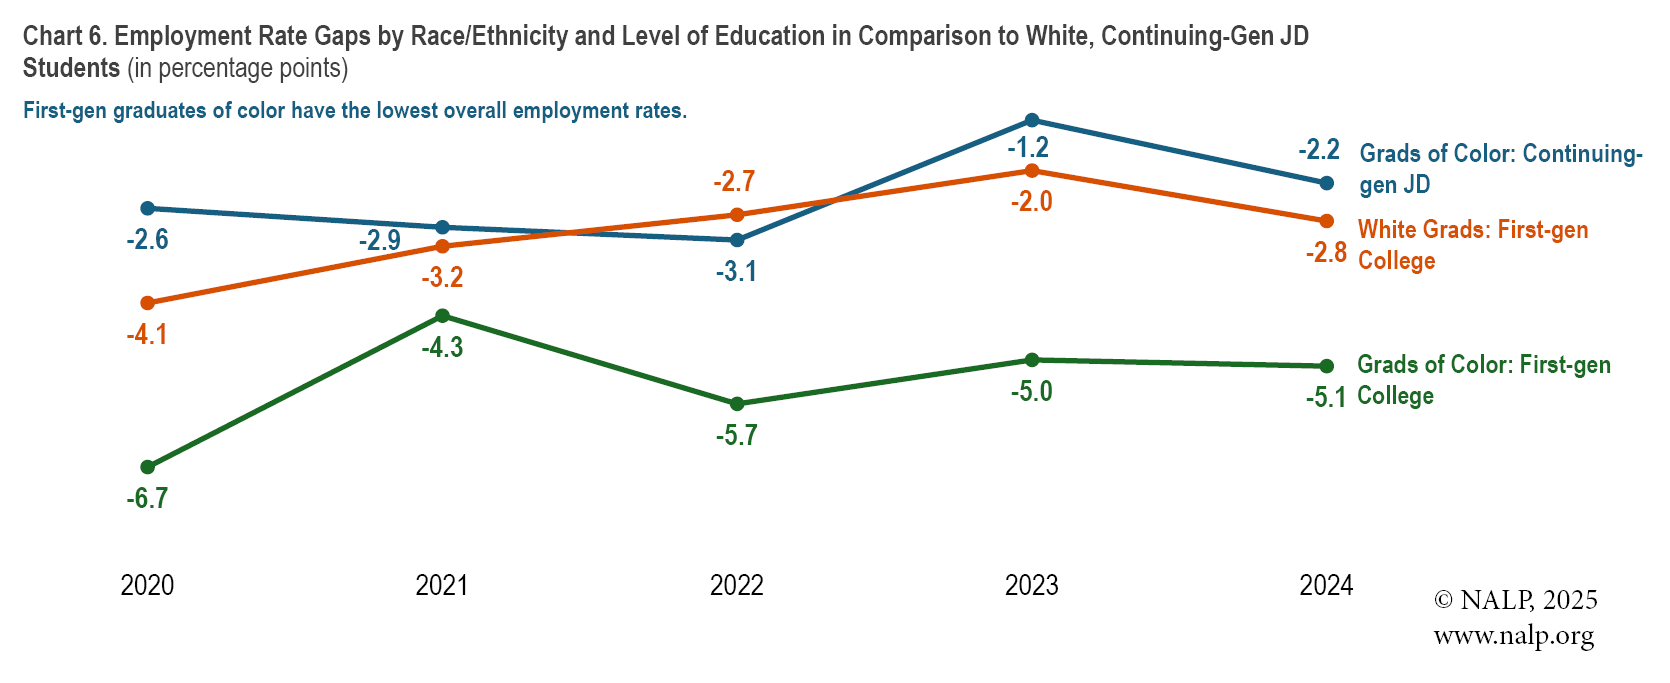
Note: A negative number indicates that a group had a lower employment rate compared to White continuing-gen JD students, and the size of that employment gap. Employment is measured in mid-March of the year following graduation (approximately 10 months post-graduation). Graduates of color includes Asian, Black or African, Latinx, Native American, Alaska Native, Native Hawaiian, Other Pacific Islander, and Multiracial graduates.
Source: NALP’s Employment Report and Salary Survey, Classes of 2020-2024
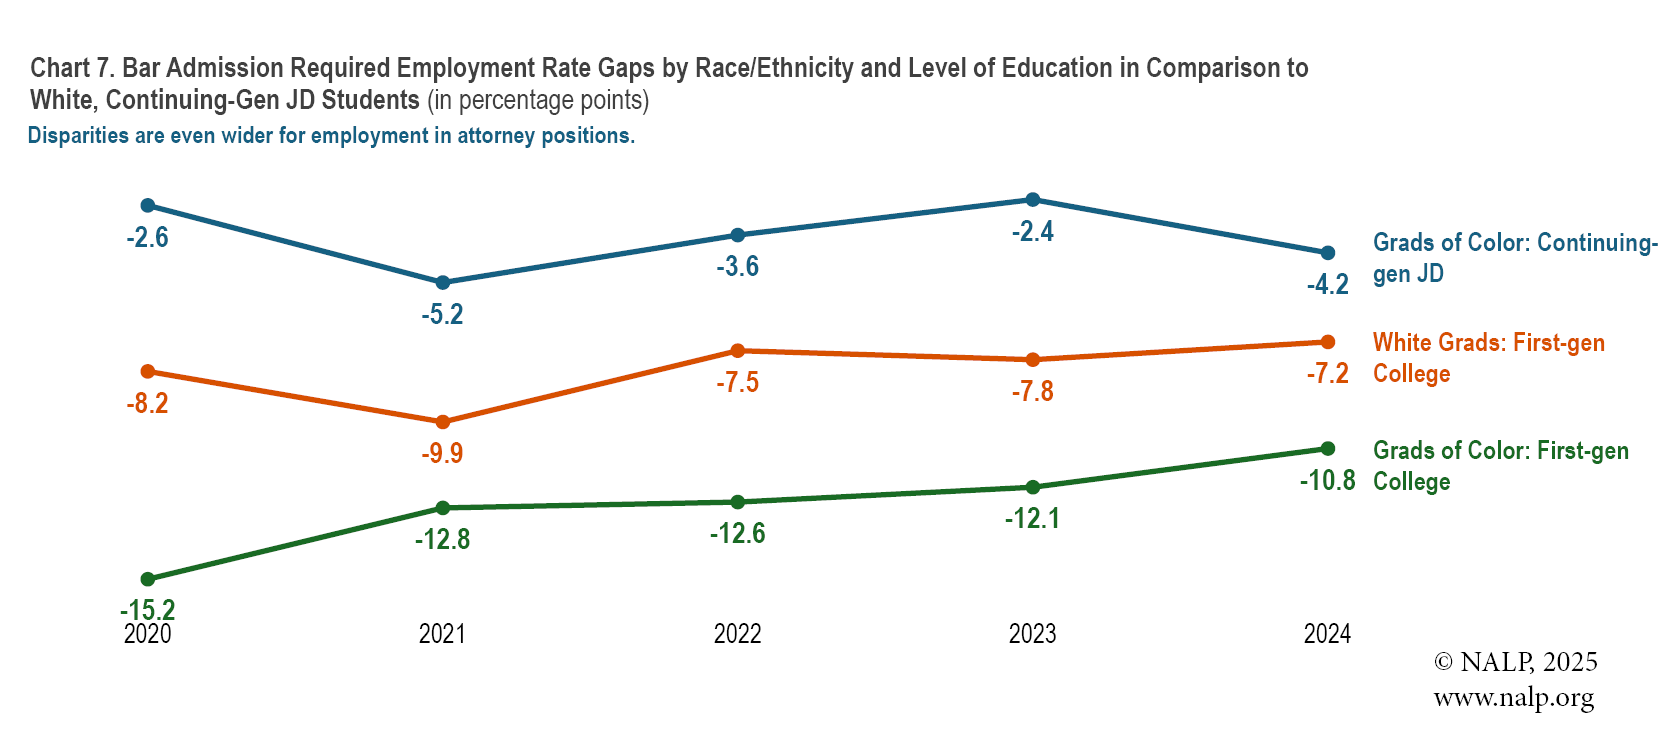
Note: A negative number indicates that a group had a lower employment rate compared to White continuing-gen JD students, and the size of that employment gap. Employment is measured in mid-March of the year following graduation (approximately 10 months post-graduation). Graduates of color includes Asian, Black or African, Latinx, Native American, Alaska Native, Native Hawaiian, Other Pacific Islander, and Multiracial graduates.
Source: NALP’s Employment Report and Salary Survey, Classes of 2020-2024
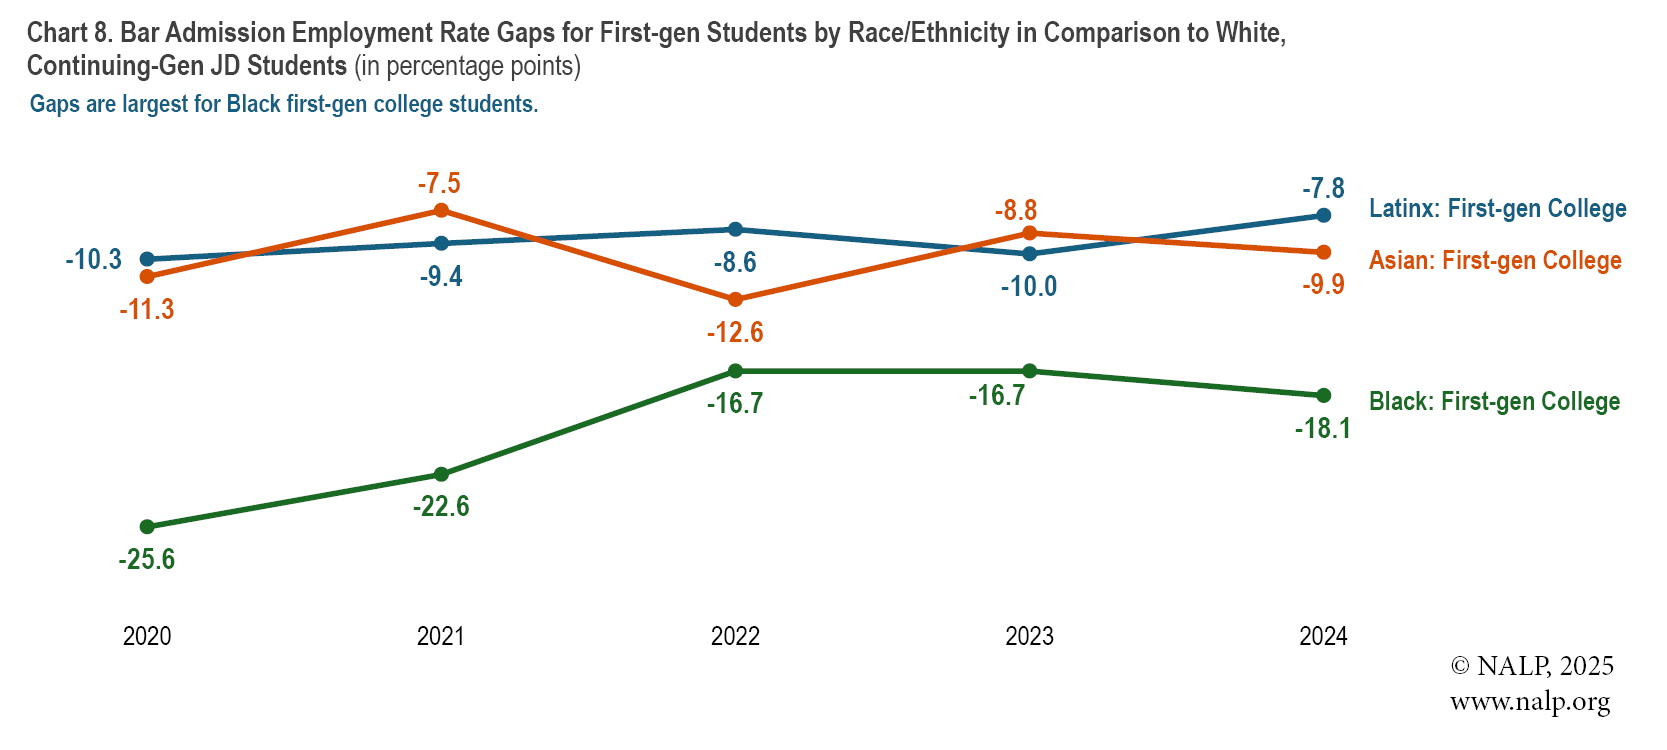
Note: A negative number indicates that a group had a lower employment rate compared to White continuing-gen JD students, and the size of that employment gap. Employment is measured in mid-March of the year following graduation (approximately 10 months post-graduation). Due to the smaller number of graduates, data are not broken out separately for Native American, Alaska Native, Native Hawaiian, Other Pacific Islander, and Multiracial graduates.
Source: NALP’s Employment Report and Salary Survey, Classes of 2020-2024