NALP Bulletin, December 2020
The recently released NALP publication, Jobs & JDs: Employment and Salaries of New Graduates — Class of 2019, features an expanded demographics section this year, including the first in-depth analysis of employment and salary outcomes for non-binary law school graduates. This article will explore these outcomes in more detail.
Background
NALP first added an "I do not identify as male or female" gender identity reporting option to the Employment Report and Salary Survey for the Class of 2014 survey, but prior to the Class of 2019, NALP's reporting on non-binary graduate data was primarily limited to counts of graduates. Due in part to the increasing number of graduates identifying as non-binary within the survey since 2014, this year's Jobs & JDs includes a more comprehensive look at the employment status, employer types, and salaries for non-binary graduates.
Beginning with the Class of 2020, NALP will be further expanding the gender identity item to include the following selection options: woman, trans woman, man, trans man, non-binary or third gender, choose to self-identify with an identity not listed, and prefer not to disclose.
Below are some key findings on the demographics, employment outcomes, and job locations for non-binary graduates from the Class of 2019.
Demographics of Class of 2019 Non-Binary Graduates
- A total of 89 Class of 2019 graduates selected the "I do not identify as male or female" gender identity.
- Class of 2019 non-binary graduates were more likely to report their sexual orientation as "gay, lesbian, or bisexual" (42.6%) or "other" (41.0%) compared to graduates overall (7.3% and 1.3%, respectively).
- Non-binary graduates were somewhat more likely to be people of color (36.6%) than the class as a whole (32.8%).
- Non-binary graduates were also more likely to report having a disability (25.9%) compared to graduates overall (4.1%).
Employment Outcomes
- The employment rate for Class of 2019 non-binary graduates was 88.6% - 1.7 percentage points lower than the class overall.
- The percentage of non-binary graduates employed in a bar passage required/anticipated job was 68.2%, a full eight percentage points below the 76.2% observed for the class as a whole. (See Chart 1.)
- The median salary for non-binary graduates in 2019 was $67,500, which is $5,000 less than the overall median of $72,500 for the class.
- This lower median salary may be attributed to the lower rate of employment in private practice for non-binary graduates and higher rate of employment in public interest jobs, which tend to pay less. Just 38.5% of Class of 2019 non-binary graduates were employed in private practice, which is nearly 17 percentage points lower than the 55.2% of graduates overall employed in law firms. Conversely, non-binary graduates were much more likely to be employed in public interest jobs compared to their peers. The percentage of non-binary graduates employed in public interest (30.8%) was almost four times the percentage of employed Class of 2019 graduates overall in this sector (8.0%). (See Chart 2.)
- Within private practice, the median salary for Class of 2019 non-binary graduates was $100,000, which is $25,000 less than the overall median salary in private practice for the class. The differential between average law firm salaries for non-binary graduates ($124,000) and graduates overall ($127,180) was much smaller.
- Employed Class of 2019 non-binary graduates were less likely to have received their job offer before graduation (57.1%) than the class as a whole (65.2%). They were also slightly more likely to be seeking a different job (12.3%) than their peers (11.3%).
- The top source of job reported for employed non-binary graduates was self-initiated contact/networking (22.4%), followed by Fall OCI and "other," both at 14.3%.
Geographic Location
- The majority (57%) of Class of 2019 non-binary graduates with a reported job location were located in just five states (including Washington, DC): California, New York, Washington, DC, Texas, and Illinois. For the class overall, 44% of all graduates with job location information were employed in these five states. (See Chart 3.)
- The top five cities for employed non-binary graduates were Washington, DC; New York, NY; Dallas, TX; Chicago, IL; and Los Angeles, CA. (See Table 1.)
- Regionally, the highest percentage of non-binary graduates were employed in the Pacific region of the United States, which includes Alaska, California, Hawaii, Oregon, and Washington. Over 31% of non-binary graduates were employed in the region compared to just under 15% of all employed graduates. (See Chart 4.)
Additional data on non-binary law school graduate outcomes are available in Jobs & JDs: Employment and Salaries of New Graduates — Class of 2019.
Chart 1: Comparison of Class of 2019 by Employment Status — Non-binary Graduates and All Graduates
(in percentages)
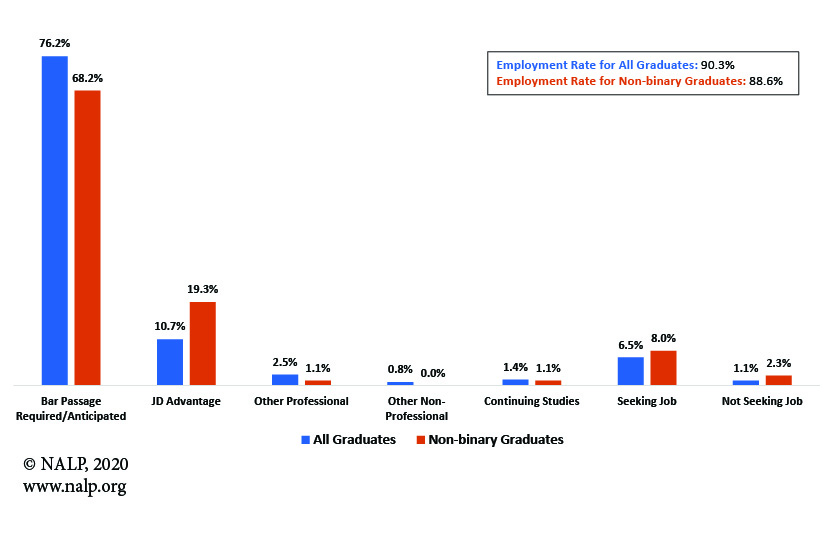
Note: Jobs for which an offer has been accepted, but for which the start date is deferred and jobs for which job type, e.g., Bar Passage Required, was not specified are not shown on the chart. Percentages are based on graduates for whom employment status was known.
Source: Jobs & JDs, Class of 2019.
Chart 2: Comparison of Class of 2019 Employer Types — Non-binary Graduates and All Graduates
(in percentages)
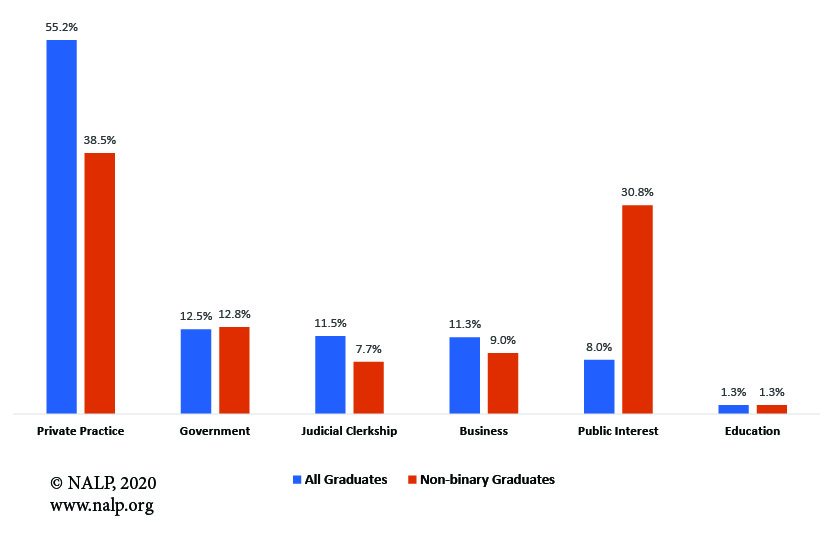
Note: Figures in this chart reflect all job types — both legal and other. For clarity, the category for unknown employer type is not shown.
Source: Jobs & JDs, Class of 2019.
Chart 3: Percentage of Employed Class of 2019 Non-binary Graduates by Job State
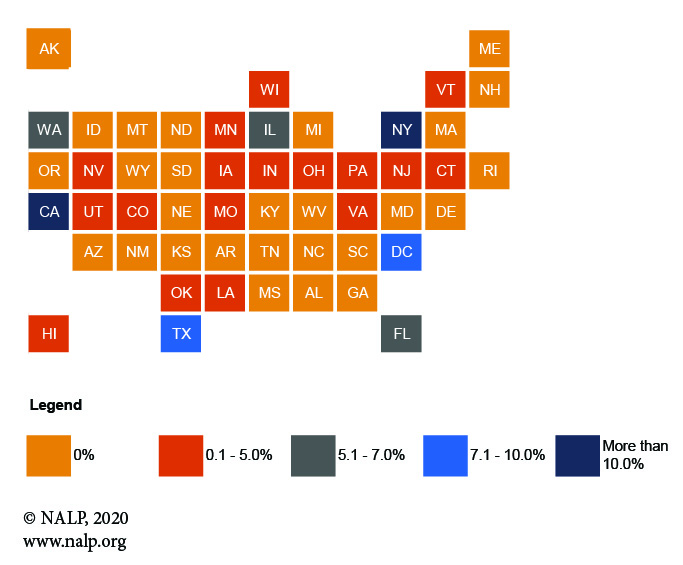
Note: The chart indicates the percentage of all employed non-binary graduates that are located within a specific state. For example, 22% of employed non-binary graduates are located in California.
Source: NALP Employment Report and Salary Survey, Class of 2019.
Chart 4: Comparison of Employed Class of 2019 Graduates by Job Census Region — Non-binary Graduates and All Graduates
(in percentages)
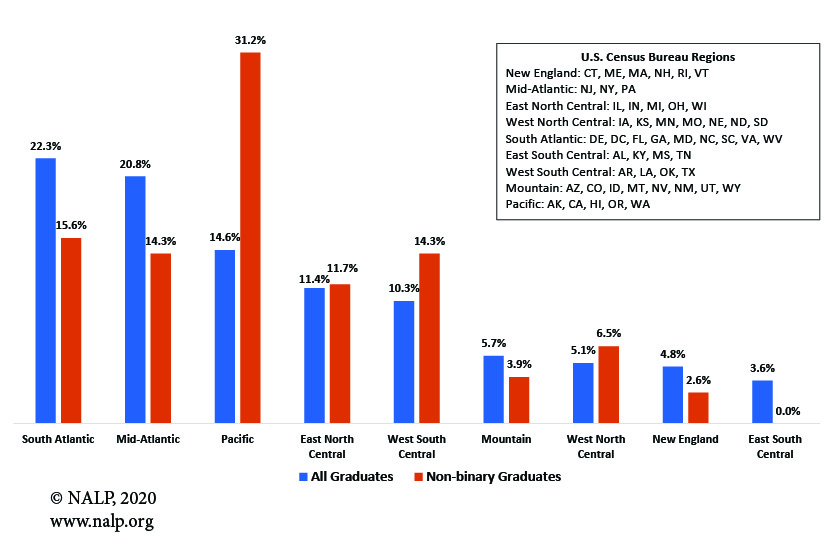
Note: Jobs in U.S. territories and in location outside of the U.S. are not shown.
Source: NALP Employment Report and Salary Survey, Class of 2019.
Table 1: Top Job Locations* for Class of 2019 Non-Binary Graduates
| City | % of Employed Non-Binary Graduates with a Known Job Location |
| Washington, DC | 9.1% |
| New York, NY | 7.8 |
| Dallas, TX | 6.5 |
| Chicago, IL | 5.2 |
| Los Angeles, CA | 5.2 |
Source: NALP Employment Report and Salary Survey, Class of 2019.
*This table includes cities with at least 5% of all employed non-binary graduates.