NALP Bulletin+
May 2026
The U.S. law firm lateral market expanded for the second consecutive year in 2025, with overall hiring up 16%. This marks a clear shift from the volatility of lateral hiring during the pandemic-era, characterized by large market swings from 2020-2023. Notably, 2025's increase was almost evenly split between increases in both partner and associate lateral hiring. This is in contrast to 2024, when growth was disproportionately driven by associate hiring. It suggests that firms were not only focused on adding capacity in 2025, but also on leveraging strategic partner hires to expand their market share and/or add practice area expertise.
Another important shift was in the market segments where lateral hiring growth was concentrated. Although lateral hiring was up across firms of all sizes in 2025, the segments with the most growth shifted compared to 2024. Smaller firms of 250 or fewer lawyers saw the largest gains in lateral hiring in 2025, with hiring up nearly 44% overall. This is quite a reversal from 2024, when lateral hiring declined by nearly 11% among firms of this size. This is in contrast to firms of more than 1,000 lawyers, which saw the smallest increase (+10.6%) in 2025. Consistent with prior years, there were also variations in hiring across regions and cities included in the analyses, with a few markets even reporting declines in lateral hiring.
This year's survey also collected information on post-clerkship and 3L hiring, and law firms reported upticks among both cohorts in 2025. Hiring of direct-to-clerkship associates, who completed a judicial clerkship immediately following law school before entering private practice, was up about 17% compared to 2024 and hiring of practice-then-clerkship associates, who had prior practice experience before completing a judicial clerkship and then returning to practice, increased by nearly 5%.
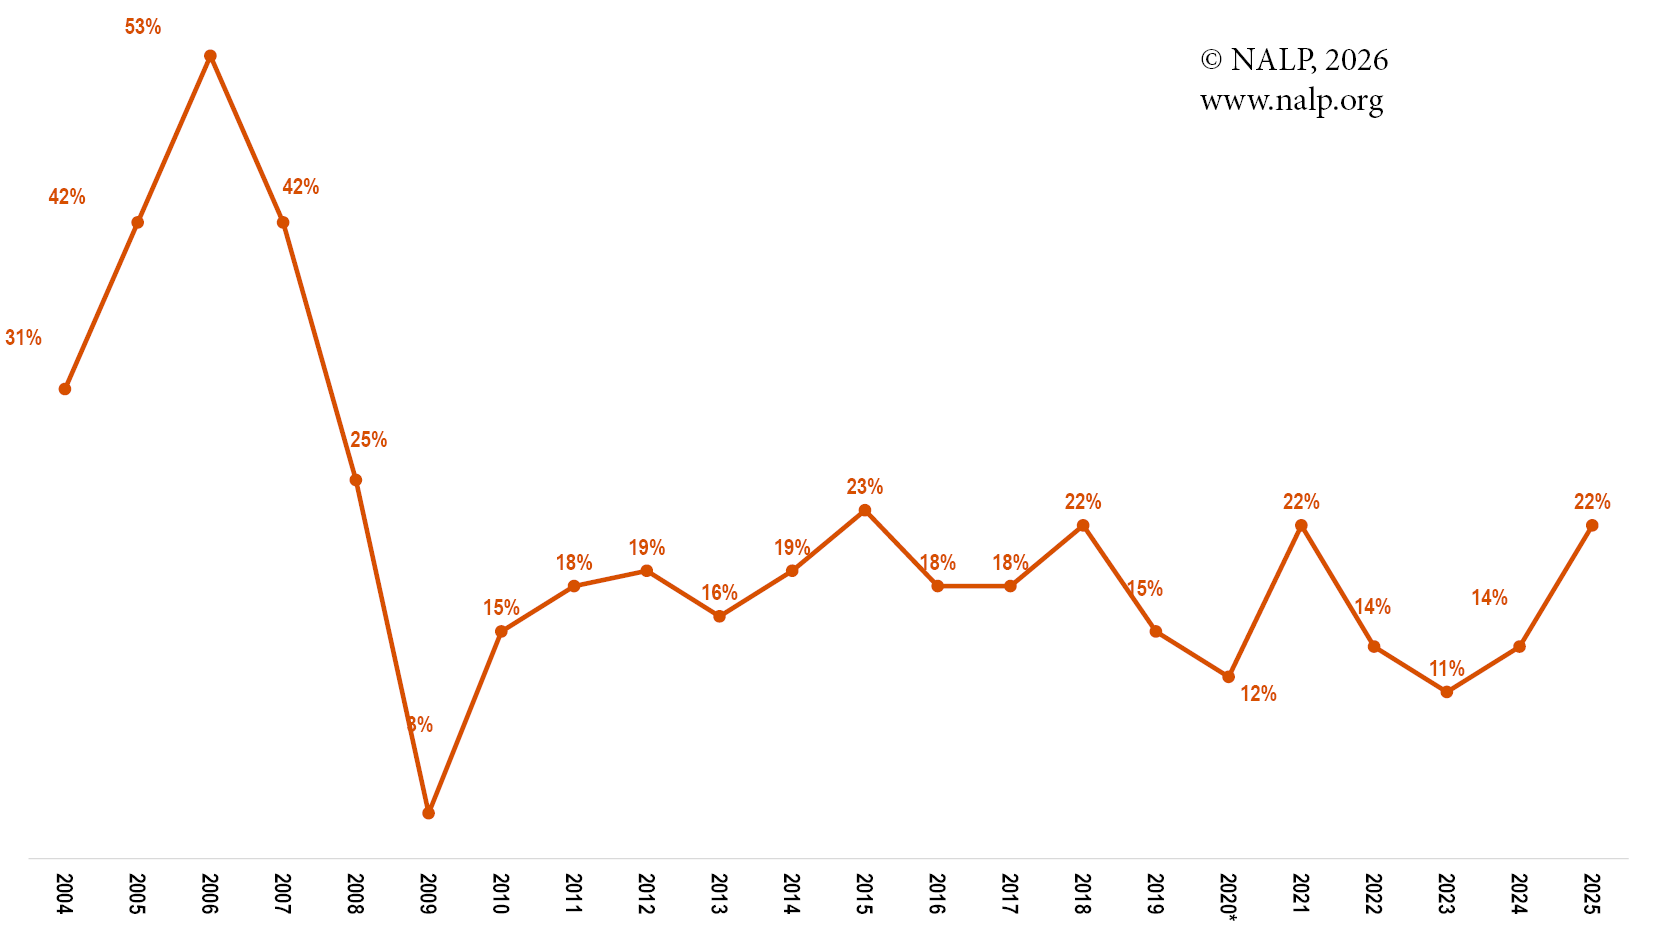
Although still relatively uncommon, the percentage of law offices that recruited 3Ls grew from 14% in 2024 to 22% in 2025. This marks the highest level of 3L recruiting since 2021, when it was also 22%. One factor that may have contributed to this increase is the rescission of Honors Program and other agency offers by the federal government in early 2025. This led to an unexpected influx of highly qualified 3L candidates in the market, and some firms strategically opened up 3L slots to recruit these students.
NALP's lateral hiring analyses are based on data collected from U.S. law firms and reflect the respondent pool, which may fluctuate from year-to-year. For calendar year 2025, 305 law offices reported their lateral hiring figures for calendar years 2024 and 2025, of which 10% of respondents came from firms of 250 or fewer lawyers, 34% from firms of 251-1,000 lawyers, and 56% from firms of more than 1,000 lawyers. A slightly higher number of employers reported post-clerkship hiring figures (308 offices) and 3L hiring data (316 offices). Firms were asked to report as much individual office-level information as possible, but in some cases, firms were only reporting firm-wide or multi-office data; therefore, in some tables, firm-wide/multi-office and office-specific information are reported separately. Key findings from the survey follow below.
Key Findings
Lateral Hiring
- Based on aggregate hiring information for 3,535 lateral lawyers in 2025, total hiring volume increased 16.4% from 2024 in these 305 offices/firms. This marks the second consecutive year of growth in lateral hiring at U.S. law firms. The median number of lateral hires was 4.0 and the average was 11.6 per office/firm. Although the average increased from 9.9 in 2024, both the average and median number of lateral hires remain below historical levels observed from 2014-2022. (See Table 1 and Table 3.)
- Lateral associate hiring accounted for 58.2% of all lateral hiring in 2025, while lateral partner hiring accounted for 22.3%. Other lateral hiring, which includes staff attorneys and counsel, comprised 19.5% of lateral hiring.
- Both lateral partner and associate hiring contributed to this year's growth, increasing 17.8% and 17.1% from 2024, respectively. This is in contrast to 2024, when associate hiring fueled much of the lateral market growth.
- As the market grew in 2025, smaller firms saw the most upward movement in overall lateral hiring. For example, lateral partner hiring experienced an 88.7% increase within firms of 250 or fewer lawyers; whereas, lateral hiring in firms of 1,001+ lawyers increased by only 10.1% in partner and 13.0% in associate hiring. (See Chart 1.)
- Measures of median and average number of hires this year were also wide-ranging. Firms reporting their data on a firm-wide basis had medians ranging from 16 to 94 total lateral hires depending on firm size, and averages of 17.1 to 101.3 hires per firm. (See section of Table 2 labeled "Firm-wide Reports.")
- Among offices reporting hiring activity for a single office, rather than firm-wide, the average number of lateral associate hires ranged from 1.1 to 8.4 by city, and the average number of lateral partners ranged from 0.5 to 2.8 hires. New York City had the highest average of lateral associates per office, while New York City and the Washington DC/Northern VA area were tied for the highest average of lateral partner hires. (See section of Table 2 labeled "Office-specific Reports.")
- Regionally, the West/Rocky Mountain area had the largest increase in overall lateral hiring (20.8%), with a particularly large increase of 63% in San Francisco. In contrast, the Midwest area saw a 9.8% decrease in 2025.
- Among cities reporting at least 30 lateral hires in 2025, the percentage change in lateral hiring ranged from a decrease of 37.2% in the Denver area to an increase of 156.0% in Boston. (See Chart 2.)
- Lateral partner hiring varied from a decrease of 79.3% in the Denver area to an increase of 600% in Austin. Lateral associate hiring varied from a decrease of 26.4% in Los Angeles & Orange County to an increase of 138.9% in Boston.
- Although there was an overall 16.4% increase in lateral hiring in 2025, outcomes were mixed across cities, regions, and firm sizes. About 47% (46.9%) of all offices experienced an increase of 16% or more in total lateral hiring, leaving about 53% with smaller increases, or even decreases, in lateral hiring.
Remote Lateral Lawyer Hiring
- A slight majority (52.1%) of offices reported that their organization has policies in place that allow them to hire fully remote lateral hires (regardless of whether they actually hired any in 2025), up from 49.2% in 2024. (See Chart 4.)
- About 47% of offices have policies that allow them to consider fully remote lateral partner hires and 42% have policies that allow them to consider fully remote lateral associate hires. These policies can differ based on the geographic location of the lateral hire.
Post-Clerkship Hiring
- This year's survey includes expanded data on post-clerkship hiring, which is reported on separately from all other lateral hiring. Responding law offices were asked to report the number of direct-to-clerkship associates who proceeded from law school to a judicial clerkship without prior practice experience and the number of practice-then-clerkship associates who practiced law at a firm or other legal employer after law school and then subsequently left practice to complete a clerkship. An average of 0.7 direct-to-clerkship associates and 0.4 practice-then-clerkship associates were hired per office/firm in calendar year 2025. In total, direct-to-clerkship hiring increased 17% and practice-then-clerkship associate hiring increased 5% compared to calendar year 2024. (See Table 4.)
- Among firms reporting firm-wide/multi-office data, the average number of direct-to-clerkship associate hires ranged from 0.6 at firms with 250 or fewer lawyers to 8.0 at firms with more than 1,000 lawyers, while practice-then-clerkship hires ranged from 0.1 to 6.8.
- Among single office submissions, direct-to-clerkship average hires ranged from 0.1 to 1.1 per office depending on firm size/region and practice-then-clerkship averages ranged from 0.1 to 0.7.
3L Hiring
- Overall, 22% of offices recruited 3L students during calendar year 2025, up from 14% in 2024. Firms of 250 or fewer lawyers and offices located in the Northeast were somewhat more likely to recruit 3Ls in 2025. (See Table 5 and Chart 5.)
- Responding offices extended 180 entry-level associate offers to 3Ls and 161 of these offers were accepted (89.4% acceptance rate).
- Most offices (60.9%) that recruited 3Ls students extended just one offer.
This year's survey results depict the strongest lateral hiring market since 2022, driven by almost equal growth in both partner and associate hiring. However, firms did not limit the focus of their recruiting to mid-level and senior talent. They also expanded their post-clerkship and 3L hiring. In particular, some firms opportunistically capitalized on the sudden availability of competitive 3L candidates in the market after the federal government rescinded job offers in early 2025. As recruiting timelines for summer programs continue to accelerate, NALP will closely track these 3L hiring figures for any changes.
For full results from prior year surveys, see NALP Bulletin+ columns posted under Entry-level and Lateral Hiring.
Table 1. Summary of Lateral Hiring — 2025
| All Lateral Hiring in 2025 | Partners | Associates | Other Lateral Lawyers |
| Median # | Average # | Total # Reported | % Change from 2024 | Median # | Average # | Total # Reported | % Change from 2024 | Median # | Average # | Total # Reported | % Change from 2024 | Median # | Average # | Total # Reported | % Change from 2024 |
| 4 | 11.6 | 3,535 | 16.4% | 1 | 2.6 | 787 | 17.8% | 2 | 6.8 | 2,059 | 17.1% | 1 | 2.3 | 689 | 13.0% |
Source: NALP 2025 Survey on Lateral and 3L Hiring
Table 2. Lateral Hiring in 2025 and Comparison with 2024
|
| Partners | Associates | Total |
|
| # of
Offices
Reporting | Median
#
Hired
in 2025 | Average
# Hired
in 2025 | %
Change
in # Hired
2024-2025 | Median
#
Hired
in 2025 | Average
# Hired
in 2025 | %
Change
in # Hired
2024-2025 | Median
#
Hired
in 2025 | Average
# Hired
in 2025 | %
Change
in # Hired
2024-2025 | % of
Offices
with
Increase
of 16.0% or
More |
| Overall Total | 305 | 1.0 | 2.6 | 17.8% | 2.0 | 6.8 | 17.1% | 4.0 | 11.6 | 16.4% | 46.9% |
| Firm-wide/Multi-office Reports |
| All firm-wide/multi-office reports | 43 | 6.0 | 10.5 | 25.6 | 16.0 | 27.8 | 20.4 | 30.0 | 48.8 | 20.5 | 60.5 |
| By Number of Lawyers Firm-wide |
| 250 or Fewer | 15 | 4.0 | 5.1 | 153.3 | 7.0 | 8.5 | 35.1 | 16.0 | 17.1 | 62.0 | 73.3 |
| 251-1,000 | 17 | 6.0 | 9.4 | 35.6 | 20.0 | 22.4 | 28.3 | 33.0 | 42.8 | 29.1 | 70.6 |
| 1,001+ | 11 | 18.0 | 19.5 | 1.9 | 52.0 | 62.4 | 14.1 | 94.0 | 101.3 | 9.3 | 27.3 |
| By NALP Region |
| Northeast | 5 | 1.0 | 4.6 | 130.0 | 10.0 | 9.0 | 66.7 | 20.0 | 17.2 | 59.3 | 60.0 |
| Office-specific Reports |
| All office specific reports | 262 | 0.0 | 1.3 | 8.7 | 2.0 | 3.3 | 12.9 | 4.0 | 5.5 | 11.0 | 44.7 |
| By Number of Lawyers Firm-wide |
| 250 or Fewer | 14 | 1.0 | 1.7 | 4.3 | 3.5 | 4.4 | 10.7 | 6.0 | 7.7 | 13.7 | 50.0 |
| 251-1,000 | 87 | 0.0 | 1.3 | -6.7 | 2.0 | 2.9 | 16.7 | 4.0 | 4.9 | 7.8 | 49.4 |
| 1,001+ | 161 | 0.0 | 1.2 | 20.4 | 2.0 | 3.4 | 11.5 | 4.0 | 5.6 | 12.2 | 41.6 |
| By NALP Region and City/State |
| Northeast | 31 | 2.0 | 2.2 | 0.0 | 3.0 | 6.8 | 21.8 | 5.0 | 9.9 | 11.3 | 41.9 |
| Boston | 7 | 1.0 | 1.9 | 116.7 | 3.0 | 6.1 | 138.9 | 5.0 | 9.1 | 156.0 | 85.7 |
| New York City | 20 | 3.0 | 2.8 | -9.8 | 4.5 | 8.4 | 9.9 | 9.0 | 12.0 | -2.4 | 30.0 |
| Mid-Atlantic | 45 | 1.0 | 1.7 | 16.7 | 2.0 | 3.6 | 7.2 | 4.0 | 6.6 | 13.3 | 46.7 |
Washington,
DC/Northern VA area | 23 | 2.0 | 2.8 | 14.3 | 4.0 | 5.3 | 19.4 | 10.0 | 10.3 | 21.0 | 56.5 |
| Southeast | 68 | 0.0 | 0.9 | -3.3 | 2.0 | 2.5 | 22.8 | 3.0 | 4.2 | 15.5 | 47.1 |
| Austin | 8 | 1.5 | 1.8 | 600.0 | 0.5 | 1.4 | 37.5 | 4.5 | 3.8 | 130.8 | 62.5 |
| Dallas | 10 | 1.0 | 1.1 | -38.9 | 2.0 | 2.9 | 3.6 | 4.5 | 5.1 | -10.5 | 40.0 |
| Houston | 11 | 1.0 | 1.5 | 30.8 | 1.0 | 2.4 | 36.8 | 4.0 | 4.5 | 25.0 | 54.5 |
Miami/Ft. Lauderdale/W.
Palm Beach | 11 | 0.0 | 0.5 | -16.7 | 0.0 | 1.1 | -25.0 | 2.0 | 2.3 | -24.2 | 27.3 |
| Midwest | 35 | 0.0 | 1.1 | 5.3 | 3.0 | 3.4 | -10.6 | 4.0 | 5.8 | -9.8 | 31.4 |
| Chicago | 16 | 1.5 | 1.8 | 16.0 | 3.0 | 4.3 | -6.8 | 5.5 | 7.3 | -7.9 | 43.8 |
| West/Rocky Mountain | 83 | 0.0 | 1.1 | 21.1 | 2.0 | 2.5 | 19.2 | 3.0 | 4.2 | 20.8 | 48.2 |
| Denver area | 11 | 0.0 | 0.5 | -79.3 | 2.0 | 3.3 | -2.7 | 3.0 | 4.5 | -37.2 | 18.2 |
Los Angeles & Orange
County | 26 | 0.0 | 0.8 | -12.5 | 2.0 | 2.0 | -26.4 | 3.0 | 3.5 | -11.7 | 38.5 |
| San Francisco | 12 | 1.0 | 1.8 | 144.4 | 1.5 | 3.4 | 57.7 | 3.5 | 6.3 | 63.0 | 58.3 |
| Silicon Valley | 7 | 0.0 | 1.0 | -12.5 | 0.0 | 1.4 | 25.0 | 2.0 | 2.9 | 25.0 | 42.9 |
Source: NALP 2025 Survey on Lateral and 3L Hiring
Note: This table includes offices/firms that reported at least one lateral hire in 2024 or 2025 and that also reported complete information for both years. Collectively, these 305 employers reported 3,535 lateral hires in 2025. The total columns include lateral hiring of partners, associates, and all other lateral lawyers combined. Cities shown had at least five offices/firms collectively report at least 20 lateral hires in 2025. Following the overall total shown in the first line, the table separates out surveys which reported information firm-wide, or for multiple offices, from those which reported office-specific information. Firm-wide information by region includes firms whose offices are predominately or wholly in that region. Office-specific information includes a few instances of firms with most lawyers located in that city or whose additional offices are located primarily in adjacent areas, and of multi-office firms consolidating two geographically adjacent offices into a single survey.
Table 3. Summary of NALP Findings on Lateral Hiring, 1999-2025
| Survey Year | % Change in Aggregate Lateral Hiring
from Previous Year | Average # of Lateral Hires | Median # of Lateral Hires |
| 2025 | 16.4% | 11.6 | 4 |
| 2024 | 13.9% | 9.9 | 4 |
| 2023 | -35.0 | 9.3 | 4 |
| 2022 | -11.5 | 15.9 | 6 |
| 2021 | 110.9 | 16.0 | 6 |
| 2020 | -30.2 | 11.7 | 5 |
| 2019 | -0.7 | 16.4 | 8 |
| 2018 | 14.4 | 16.5 | 7 |
| 2017 | 1.6 | 15.1 | 7 |
| 2016 | -10.8 | 15.1 | 6 |
| 2015 | 8.5 | 14.8 | 6 |
| 2014 | 4.8 | 14.0 | 5 |
| 2013 | -7.3 | 11.1 | 5 |
| 2012 | -6.3 | 10.3 | 6 |
| 2011 | 48.5 | 9.5 | 5 |
| 2010 | 38.4 | 8.0 | 4 |
| 2009 | -52.2 | 5.1 | 2 |
| 2008 | -26.3 | 8.9 | 4 |
| 2007 | 11.4 | 12 | 7 |
| 2006 | 7.6 | 12 | 7 |
| 2005 | 19.1 | 12 | 7 |
| 2004 | 15.2 | 10 | 6 |
| 2003 | 17.7 | 9 | 5 |
| 2002 | -17.3 | 7 | 4 |
| 2001 | -22.8 | 10 | 6 |
| 2000 | 41.8 | 16 | 10 |
| 1999 | 2.6 | 12 | 8 |
Sources: NALP 2025 Survey on Lateral and 3L Hiring, NALP Lateral Hiring Survey 2021-24; NALP Survey of Legal Employers on Recruiting/Snapshot of the Recruiting Season Survey, 1999-2020
Table 4. 2025 Hiring of Post-Clerkship Associates
| # of Offices Reporting | Direct-to-Clerkship Associates | Practice-then-Clerkship Associates |
| Median # Hired in 2025 | Average # Hired in 2025 | Median # Hired in 2025 | Average # Hired in 2025 |
| Overall Total | 308 | 0.0 | 0.7 | 0.0 | 0.4 |
| Firm-wide/Multi-office Reports by Firm Size |
| All firm-wide/multi-office reports | 40 | 1.0 | 2.7 | 0.0 | 1.9 |
| Firms of 250 or fewer lawyers | 14 | 0.0 | 0.6 | 0.0 | 0.1 |
| Firms of 251-1,000 lawyers | 16 | 0.5 | 1.3 | 0.0 | 0.4 |
| Firms of 1,001+ lawyers | 10 | 2.5 | 8.0 | 1.5 | 6.8 |
| Office-specific Reports by Firm Size |
| All office-specific reports | 268 | 0.0 | 0.4 | 0.0 | 0.2 |
| Firms of 250 or fewer lawyers | 15 | 0.0 | 1.1 | 0.0 | 0.4 |
| Firms of 251-1,000 lawyers | 90 | 0.0 | 0.4 | 0.0 | 0.1 |
| Firms of 1,001+ lawyers | 163 | 0.0 | 0.3 | 0.0 | 0.2 |
| Office-specific Reports by Region |
| Northeast | 32 | 0.0 | 0.4 | 0.0 | 0.7 |
| Mid-Atlantic | 48 | 0.0 | 0.8 | 0.0 | 0.1 |
| Southeast | 69 | 0.0 | 0.3 | 0.0 | 0.1 |
| Midwest | 35 | 0.0 | 0.6 | 0.0 | 0.1 |
| West/Rocky Mountain | 84 | 0.0 | 0.1 | 0.0 | 0.2 |
Source: NALP 2025 Survey on Lateral and 3L Hiring
Note: Direct-to-clerkship associates are associates who proceeded directly from law school to a judicial clerkship and then joined a law office following completion of the clerkship, without prior practice experience. Practice-then-clerkship associates are associates who practiced law at a firm or other legal employer after graduating from law school, subsequently left practice to complete a judicial clerkship, and then returned to practice following the clerkship. Post-clerkship associates are not included in any other counts of lateral associates reported elsewhere in this article. Collectively, these 308 offices/firms hired 209 direct-to-clerkship associates and 130 practice-then-clerkship associates in calendar year 2025. This reflects a 17.2% increase in direct-to-clerkship associate hires and a 4.8% increase in practice-then-clerkship associate hires compared to calendar year 2024. Following the overall total shown in the first line, the table separates out surveys which reported information firm-wide, or for multiple offices, from those which reported office-specific information.
Table 5. Prevalence of 3L Recruiting in 2025
| # of Offices Reporting | % of Offices Recruiting 3Ls |
| Overall Total | 316 | 21.8% |
| By Firm Size |
| Firms of 250 or fewer lawyers | 29 | 27.6 |
| Firms of 251-1,000 lawyers | 113 | 17.7 |
| Firms of 1,001+ lawyers | 174 | 23.6 |
| By Region |
| Northeast | 36 | 25.0 |
| Mid-Atlantic | 51 | 21.6 |
| Southeast | 78 | 15.4 |
| Midwest | 38 | 21.1 |
| West/Rocky Mountain | 88 | 15.9 |
Source: NALP 2025 Survey on Lateral and 3L Hiring
Note: Collectively, 69 out of 316 responding offices/firms recruited 3L students during calendar year 2025. This includes offices that ultimately did not make any offers to 3L students. Overall, these offices reported a median of one and an average of 2.6 entry-level associate offers to 3L students. Most offices (60.9%) reported making just one offer. In total, 180 offers were made and 161 offers were accepted (89.4% acceptance rate). Data by firm size and region include both single office and multi-office/firm-wide submissions. However, regional analyses include only firm-wide submissions from firms whose offices are predominantly or entirely located within the region.
Chart 1. Percent Change in Lateral Hiring from 2024 to 2025 by Firm Size (in # of lawyers)
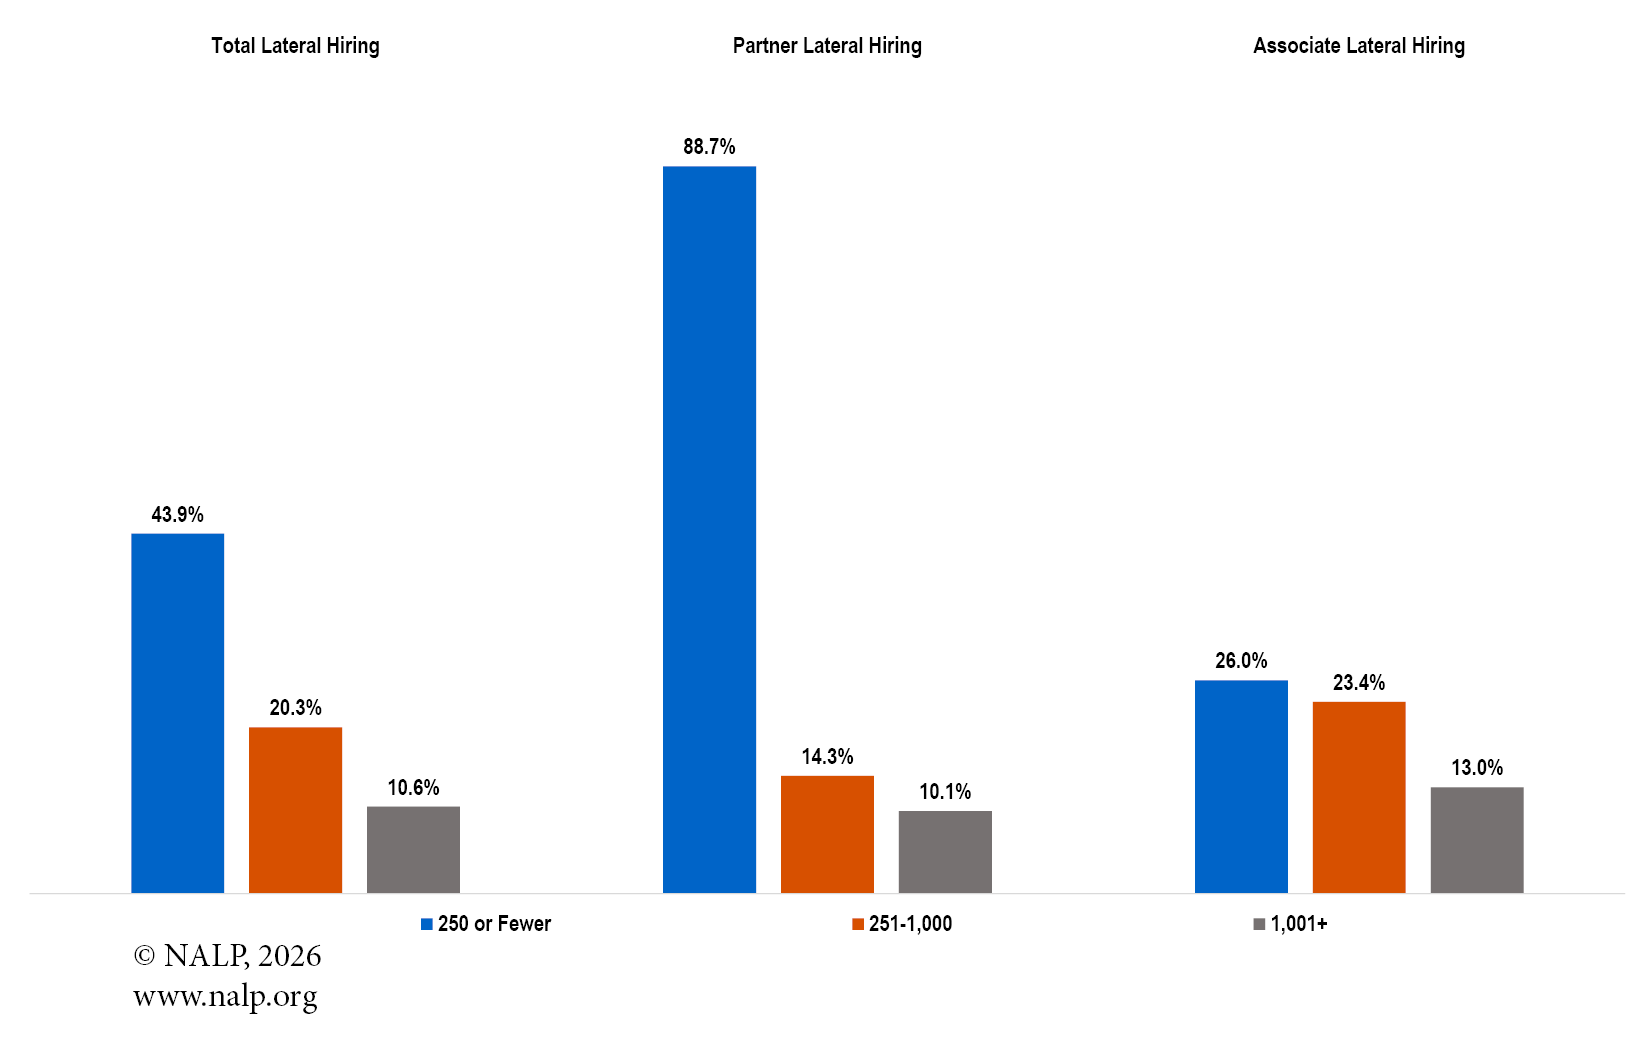
Source: NALP 2025 Survey on Lateral and 3L Hiring
Note: Data by firm size is inclusive of both firm-wide/multi-office and office-specific reporting. Total lateral hiring includes partner, associate, and other lateral lawyer hires.
Chart 2. Percent Change in Aggregate Lateral Hiring from 2024 for Cities/States with 30 or More Lateral Hires in 2025
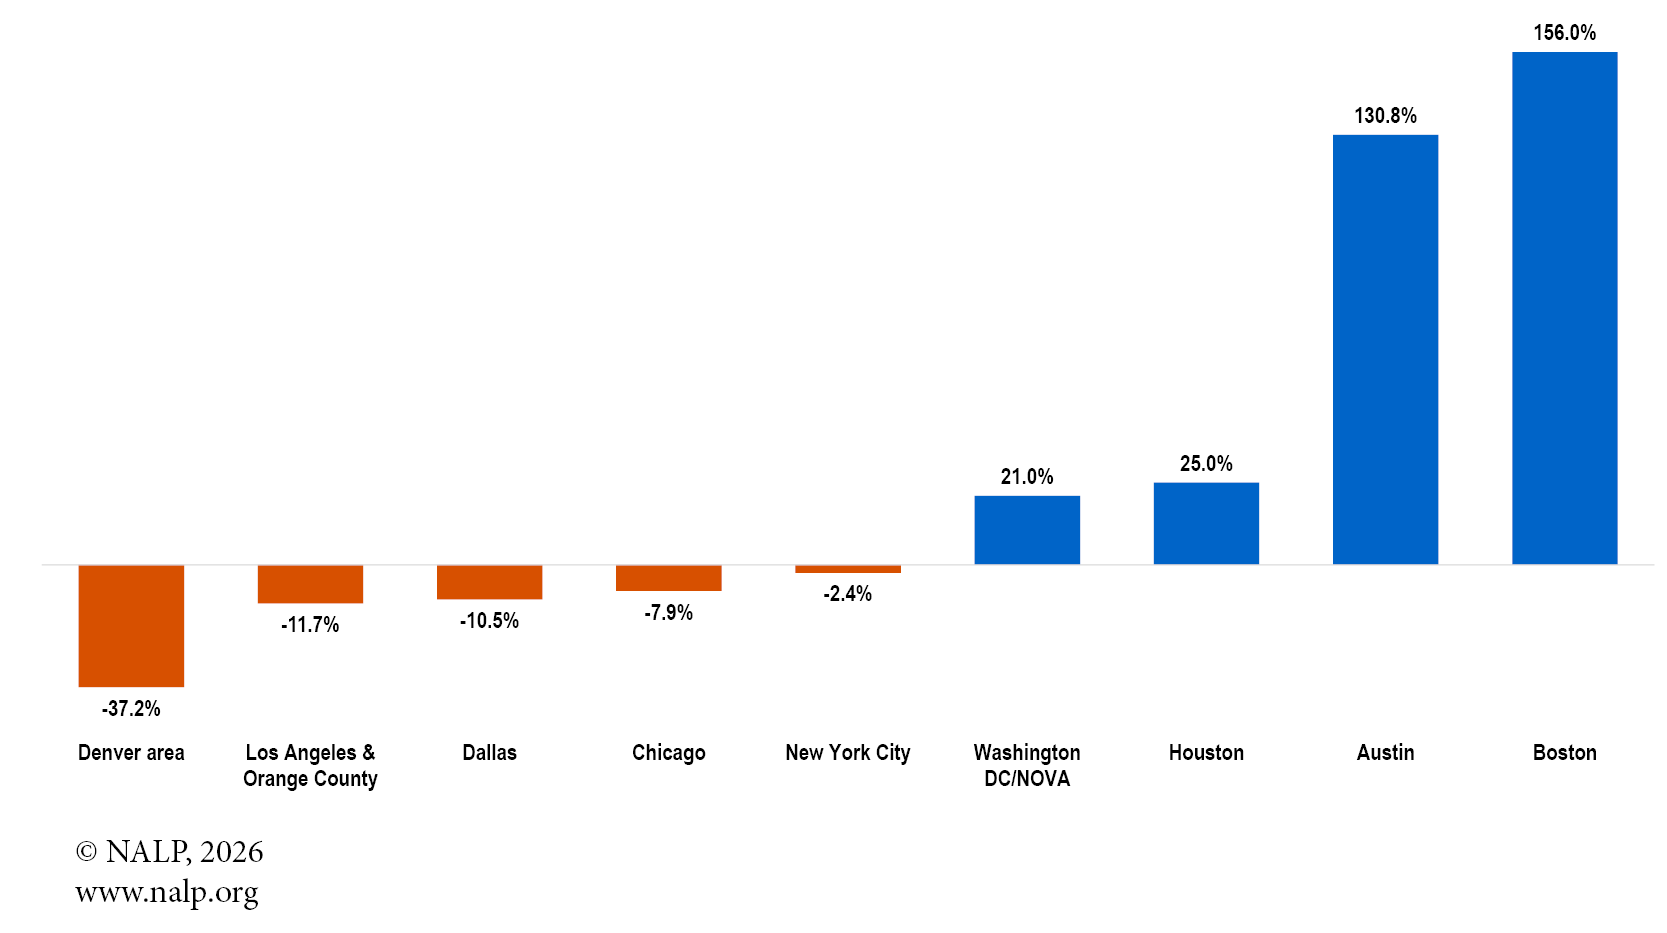
Source: NALP 2025 Survey on Lateral and 3L Hiring
Chart 3. Percent Change in Aggregate Lateral Hiring from Previous Year, 1999 - 2025
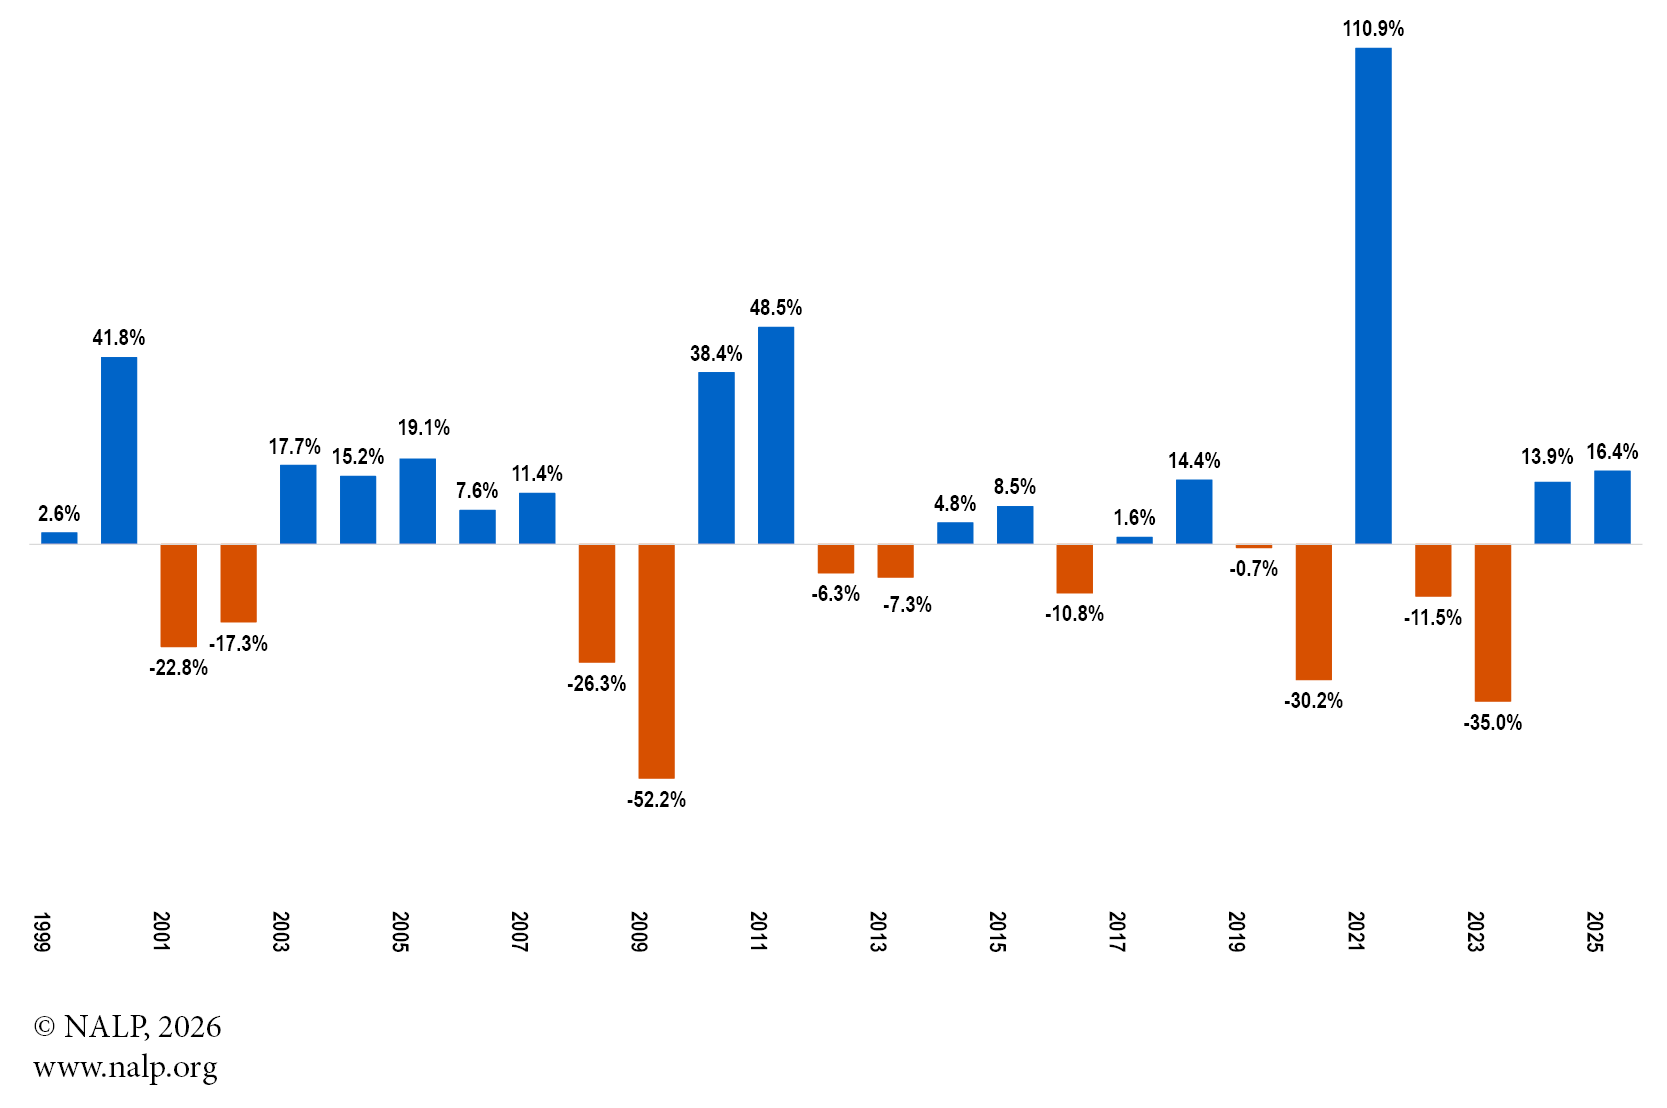
Sources: NALP 2025 Survey on Lateral and 3L Hiring, Survey on 2021-24 Lateral Hiring; NALP Survey of Legal Employers on Recruiting/Snapshot of the Recruiting Season Survey, 1999-2020
Chart 4. General Office Policies Regarding Lateral Remote Hires (regardless of whether the office hired any remote lateral lawyers in 2025)
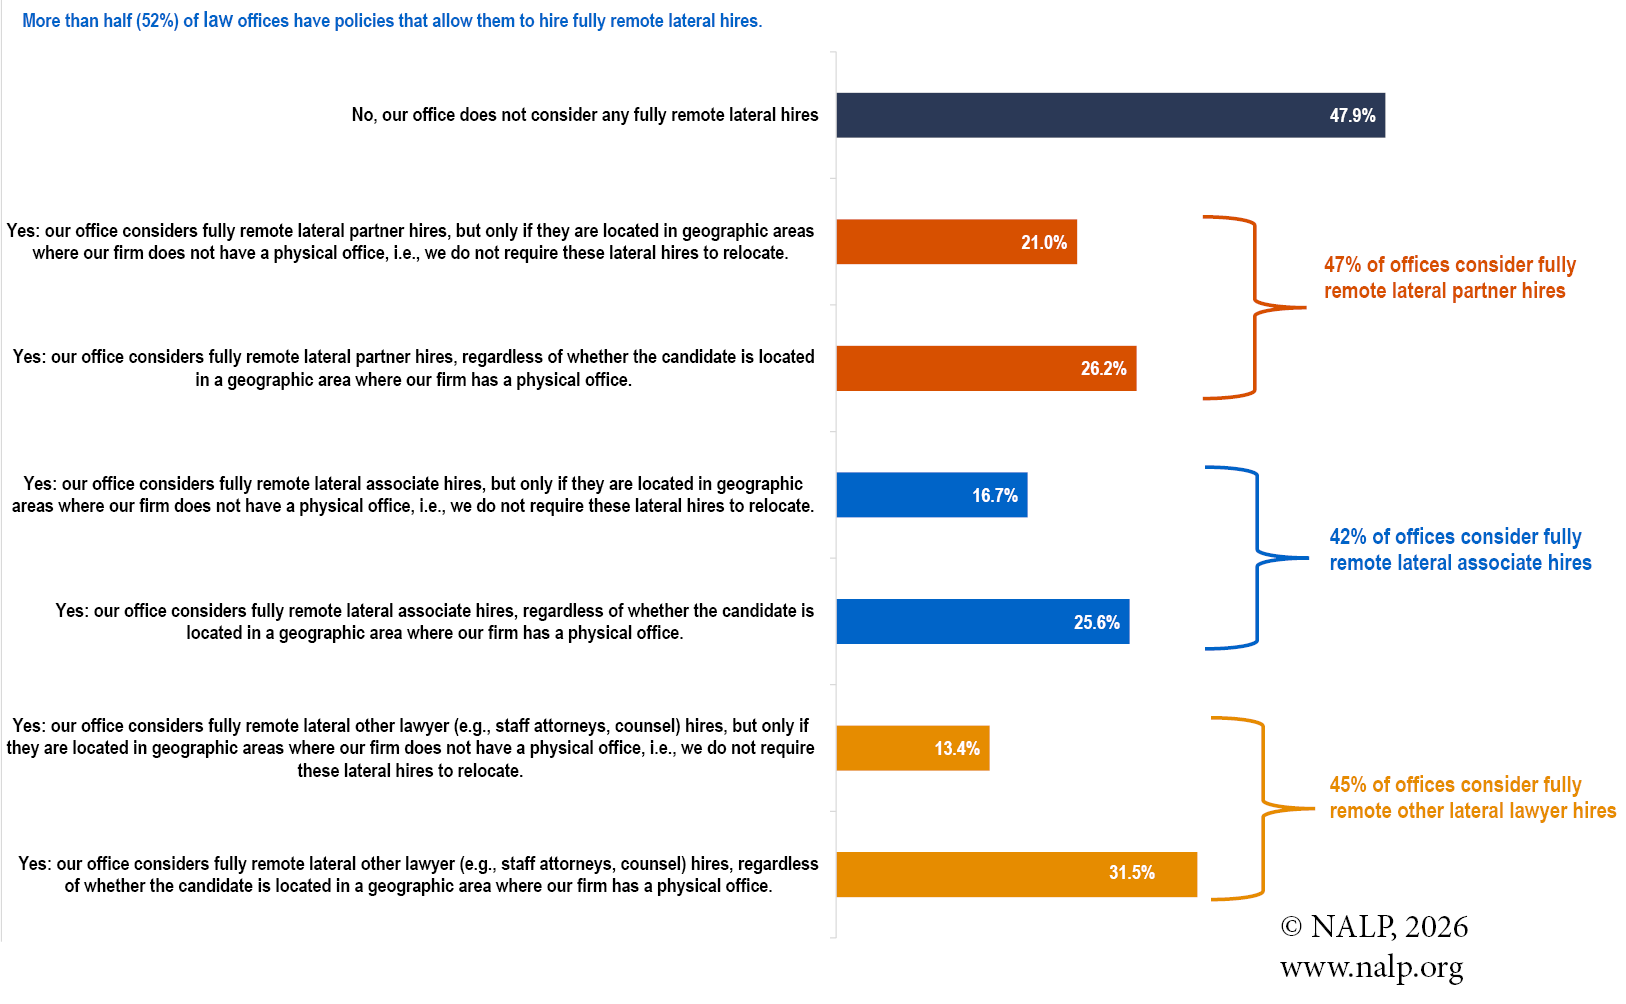
Source: NALP 2025 Survey on Lateral and 3L Hiring
Note: Percentages are based on responses from 305 offices to a question regarding their general office policies regarding the hiring of fully remote lateral lawyers, regardless of whether they hired any during the 2025 calendar year.
Chart 5. Percentage of Law Offices That Recruited 3Ls for Entry-Level Associate Positions, 2004 - 2025
Sources: NALP 2025 Survey on Lateral and 3L Hiring and NALP Survey of Legal Employers on Recruiting, 2004-2024
Note: Reported as the percentage of offices that extended at least one interview invitation to a current 3L who had not previously worked for that employer, even if no offers were ultimately made. *The 2020 recruiting cycle took place through spring 2021.