NALP Bulletin+
March 2026
JD Advantage positions are jobs for which a JD provides a demonstrable advantage in obtaining or performing the job, but the position itself does not require bar admission, an active law license, or involve practicing law. Examples of such positions include, but are not limited to, compliance managers, contract administrators, patent agents, privacy analysts, human resources professionals, and investment bankers. Although both the share and the number of new law graduates entering JD Advantage roles immediately following graduation have declined in recent years as more graduates take attorney positions, these jobs still account for about 7% of all entry-level positions.
NALP's latest analyses from the Class of 2024 Employment Report and Salary Survey reveal that despite the decreasing number of graduates entering JD Advantage careers over the last decade, the vast majority of these positions (86%) remain high-quality jobs in terms of being both long-term and full-time. Key findings from the tables and charts that follow are highlighted below.
Key Findings on JD Advantage Positions
- The percentage of jobs obtained by new law graduates which are JD Advantage almost doubled in the ten-year period from 2006-2016, increasing from 8.8% of all jobs to 16.9%. However, since 2016, this figure has declined by nearly 10 percentage points, dropping to 7.4% for the Class of 2024. This falloff has coincided with record high rates of graduates entering bar admission required positions (i.e., attorney roles). (See Table 1.)
- The downturn in JD Advantage employment is most pronounced in the government and public interest sectors, where the share of these roles has fallen by approximately 13 and 10 percentage points, respectively, since 2016. For the Class of 2024, fewer than 10% of entry-level positions in these sectors were JD Advantage careers. In contrast, nearly half (47%) of all jobs secured in business by the Class of 2024 were JD Advantage roles, although that is down from a peak of approximately 52% in 2016 and 2018. (See Table 2.)
- The differential in median starting salaries for JD Advantage jobs in comparison to all jobs has varied over time. In 2008, the gap was $12,000; however, it closed to about $3,000 - $5,000 from 2012-2018. The gap then widened again and stands at $13,000 for the Class of 2024. (See Chart 1 and Table 3.)
- Nearly 86% of JD Advantage jobs obtained by the Class of 2024 were both long-term and full-time. In the government and business sectors, this figure peaked at 90%. (See Table 4.)
Additional findings focused on JD Advantage jobs in business, a sector which has typically accounted for 40-50% of the JD Advantage jobs taken by law school graduates since 2006, are presented in Table 5 and Table 6.
Key Findings on JD Advantage Jobs in Business
- Among business job types classified as JD Advantage for the Class of 2024, compliance positions were the most common, accounting for nearly one in six jobs (16%). Tax associates followed at 12%, with consulting positions close behind at 11%. (See Table 5.)
- By business setting, JD Advantage roles for the Class of 2024 were most concentrated in banking/finance (17%), followed by accounting firms (14%), and then technology companies (law-related or not) at 8%. (See Table 6.)
Learn More About JD Advantage Careers and Outcomes
If you would like to learn more about JD Advantage careers, NALP's JD Advantage Career Guide provides an in-depth profile of several JD Advantage career areas and settings and NALP's Class of 2024 Jobs & JDs report includes additional information on JD Advantage roles and salary outcomes.
Table 1. JD Advantage Jobs, Classes of 2006 – 2024
| Class Year | % of Graduates for Whom Employment Status was Known Employed in JD Advantage Jobs | Total # of Jobs Taken | Total # of JD Advantage Jobs | % of Jobs that were JD Advantage | # of JD Advantage Jobs Obtained in Business |
| 2024 | 6.9% | 35,335 | 2,615 | 7.4% | 1,163 |
| 2022 | 9.2% | 32,318 | 3,214 | 9.9% | 1,501 |
| 2020 | 10.4% | 29,382 | 3,465 | 11.8% | 1,494 |
| 2018 | 12.5% | 29,953 | 4,178 | 13.9% | 2,020 |
| 2016 | 14.8% | 31,354 | 5,311 | 16.9% | 2,537 |
| 2014 | 14.8% | 36,350 | 6,228 | 17.0% | 3,118 |
| 2012 | 13.3% | 37,538 | 5,877 | 15.7% | 2,628 |
| 2010 | 10.7% | 36,043 | 4,387 | 12.2% | 1,591 |
| 2008 | 8.1% | 36,497 | 3,277 | 9.0% | 1,473 |
| 2006 | 7.9% | 36,465 | 3,194 | 8.8% | 1,531 |
Note: For the years 2006-2010 JD Advantage jobs were referred to as JD Preferred. The category was renamed to JD Advantage starting with the Class of 2011.
Source: NALP's Employment Report and Salary Survey, Classes of 2006-2024
Table 2. Percentage of All Jobs that are Bar Admission Required/Anticipated (BAR/A) vs. JD Advantage (JDA) by Employment Sector, 2006 - 2024
| Employment Sector | Class Year |
| 2006 | 2008 | 2010 | 2012 | 2014 | 2016 | 2018 | 2020 | 2022 | 2024 |
| All Jobs |
| % of Jobs that are BAR/A | 84.0% | 83.9% | 79.1% | 76.3% | 76.5% | 77.4% | 81.5% | 84.3% | 86.8% | 90.2% |
| % of Jobs that are JDA | 8.9 | 9.1 | 12.3 | 15.7 | 17.1 | 16.9 | 13.9 | 11.8 | 9.9 | 7.4 |
| Education |
| % of Jobs that are BAR/A | 16.4 | 20.6 | 33.3 | 17.9 | 20.8 | 14.4 | 17.4 | 13.5 | 17.3 | 24.8 |
| % of Jobs that are JDA | 40.8 | 44.3 | 39.7 | 49.0 | 50.4 | 47.4 | 52.2 | 54.2 | 56.1 | 50.8 |
| Business |
| % of Jobs that are BAR/A | 34.8 | 33.3 | 32.2 | 29.2 | 27.3 | 24.0 | 25.5 | 28.9 | 31.2 | 32.6 |
| % of Jobs that are JDA | 30.1 | 30.5 | 29.6 | 39.3 | 47.4 | 51.9 | 52.1 | 48.3 | 47.5 | 47.0 |
| Private Practice |
| % of Jobs that are BAR/A | 96.2 | 96.9 | 94.3 | 93.2 | 93.1 | 91.8 | 94.1 | 94.8 | 96.3 | 97.4 |
| % of Jobs that are JDA | 3.4 | 2.8 | 5.2 | 6.2 | 6.6 | 7.7 | 5.6 | 5.0 | 3.5 | 2.5 |
| Government |
| % of Jobs that are BAR/A | 81.4 | 80.4 | 74.3 | 71.0 | 71.9 | 72.4 | 76.1 | 77.4 | 82.5 | 88.0 |
| % of Jobs that are JDA | 11.5 | 12.6 | 17.9 | 22.8 | 22.3 | 21.7 | 18.0 | 17.3 | 13.2 | 9.2 |
| Public Interest |
| % of Jobs that are BAR/A | 85.9 | 81.7 | 76.1 | 76.9 | 77.5 | 78.7 | 81.6 | 85.5 | 87.5 | 90.7 |
| % of Jobs that are JDA | 10.0 | 13.6 | 18.1 | 18.4 | 18.0 | 17.5 | 15.3 | 12.4 | 10.3 | 7.6 |
Note: For the years 2006-2010 JD Advantage jobs were referred to as JD Preferred. The category was renamed to JD Advantage starting with the Class of 2011.
Source: NALP's Employment Report and Salary Survey, Classes of 2006-2024
Chart 1. Median and Average Starting Salaries for JD Advantage Jobs in Comparison to All Jobs, Classes of 2006 - 2024
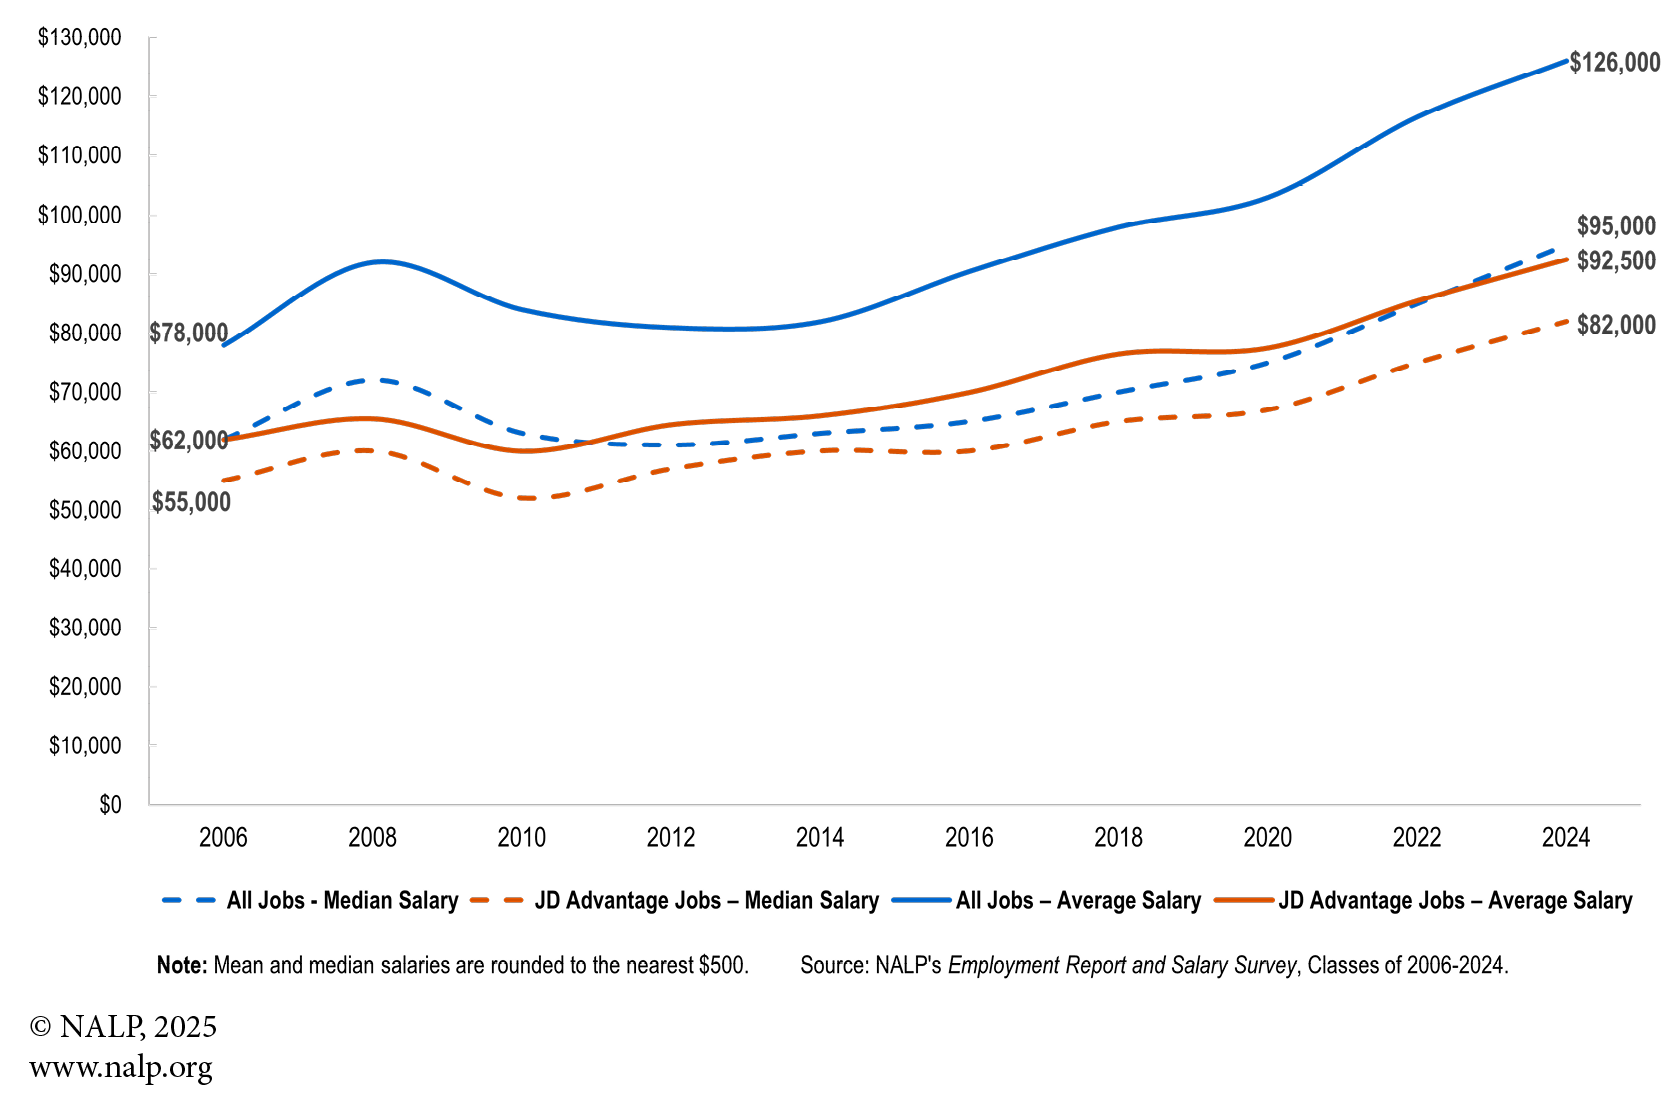
Table 3. Median and Average Starting Salaries for JD Advantage Jobs in Comparison to All Jobs, 2006 - 2024
| Law School Graduating Class of: |
| 2006 | 2008 | 2010 | 2012 | 2014 | 2016 | 2018 | 2020 | 2022 | 2024 |
| All Jobs - Median Salary ($) | $62,000 | $72,000 | $63,000 | $61,000 | $63,000 | $65,000 | $70,000 | $75,000 | $85,000 | $95,000 |
| JD Advantage Jobs – Median Salary ($) | $55,000 | $60,000 | $52,000 | $57,000 | $60,000 | $60,000 | $65,000 | $67,000 | $75,000 | $82,000 |
| All Jobs – Average Salary ($) | $78,000 | $92,000 | $84,000 | $81,000 | $82,000 | $90,500 | $98,000 | $103,000 | $116,500 | $126,000 |
| JD Advantage Jobs – Average Salary ($) | $62,000 | $65,000 | $60,000 | $64,500 | $66,000 | $70,000 | $76,500 | $77,500 | $85,500 | $92,500 |
Note: Mean and median salaries are rounded to the nearest $500.
Source: NALP's Employment Report and Salary Survey, Classes of 2006-2024
Table 4. Characteristics of JD Advantage Jobs by Employer Setting — Class of 2024
| Percent of JD Advantage Jobs in Each Sector Which Were: |
| Full-Time and Long-Term | Part-Time and Long-Term | Full-Time and Short-Term | Part-Time and Short-Term |
| All JD Advantage Jobs | 85.5% | 5.7% | 3.9% | 4.8% |
| JD Advantage Jobs in Business | 93.5 | 2.5 | 2.0 | 2.1 |
| JD Advantage Jobs in Private Practice | 66.7 | 14.7 | 7.8 | 10.5 |
| JD Advantage Jobs in Government | 90.5 | 3.8 | 3.8 | 1.9 |
| JD Advantage Jobs in Public Interest | 78.5 | 6.9 | 8.0 | 6.1 |
| JD Advantage Jobs in Education | 86.6 | 4.1 | 0.8 | 8.5 |
Note: Percentages may not add up to 100% because one or both of the job characteristics were not reported for a small number of jobs.
Source: NALP's Employment Report and Salary Survey, Class of 2024
Table 5. Top Job Types for JD Advantage Jobs in Business — Class of 2024
| Type of Business Job | # of Jobs | % of All JD Advantage Jobs in Business |
| Compliance | 180 | 15.5% |
| Tax Associate | 140 | 12.0 |
| Consulting | 131 | 11.3 |
| Contract Manager/Analyst | 102 | 8.8 |
| Management | 93 | 8.0 |
| Law Clerk or Paralegal | 62 | 5.3 |
| Self-employed | 56 | 4.8 |
Note: Percentages are based on all JD Advantage jobs obtained in business for the Class of 2024, a total of 1,163 jobs. The category of “other” job in business accounts for the largest share of JD Advantage jobs in business, at 27.2%, and is not shown above. Other categories shown in the table each accounted for at least 50 jobs.
Source: NALP's Employment Report and Salary Survey, Class of 2024
Table 6. Top Kinds of Employers for JD Advantage Jobs in Business — Class of 2024
| Kind of Business Employer | # of Jobs | % of All JD Advantage Jobs in Business |
| Banking/Finance | 198 | 17.0% |
| Accounting | 163 | 14.0 |
| Technology/Legal Technology | 98 | 8.4 |
| Healthcare | 81 | 7.0 |
| Entertainment/Sports Management Company | 68 | 5.8 |
| Management Consulting | 63 | 5.4 |
| Insurance | 63 | 5.4 |
| Real Estate | 56 | 4.8 |
Note: Percentages are based on all JD Advantage jobs obtained in business for the Class of 2024, a total of 1,163 jobs. The category of “other” business employer accounts for the largest share of JD Advantage jobs in business, at 27.0%, and is not shown above. Other categories shown in the table each accounted for at least 50 jobs.
Source: NALP's Employment Report and Salary Survey, Class of 2024